

Invest in 5,000+ US Stocks and ETFs
* Offering through VF Securities, Inc. (member FINRA/SIPC)
 Skip to content
Apple Inc. designs, manufactures, and markets smartphones, personal computers, tablets, wearables, and accessories worldwide. The company offers iPhone, a line of smartphones; Mac, a line of personal computers; iPad, a line of multi-purpose tablets; and wearables, home, and accessories comprising AirPods, Apple TV, Apple Watch, Beats products, and HomePod. It also provides AppleCare support and cloud services; and operates various platforms, including the App Store that allow customers to discover and download applications and digital content, such as books, music, video, games, and podcasts. In addition, the company offers various services, such as Apple Arcade, a game subscription service; Apple Fitness+, a personalized fitness service; Apple Music, which offers users a curated listening experience with on-demand radio stations; Apple News+, a subscription news and magazine service; Apple TV+, which offers exclusive original content; Apple Card, a co-branded credit card; and Apple Pay, a cashless payment service, as well as licenses its intellectual property. The company serves consumers, and small and mid-sized businesses; and the education, enterprise, and government markets. It distributes third-party applications for its products through the App Store. The company also sells its products through its retail and online stores, and direct sales force; and third-party cellular network carriers, wholesalers, retailers, and resellers. Apple Inc. was founded in 1976 and is headquartered in Cupertino, California. more
| Time Frame | AAPL | Sector | S&P500; |
|---|---|---|---|
| 1-Week Return | 4.11% | 1.14% | -0.09% |
| 1-Month Return | 1.92% | -0.89% | 0.54% |
| 3-Month Return | -4.92% | 8.79% | 9.04% |
| 6-Month Return | -2.05% | 22.52% | 20.34% |
| 1-Year Return | 10.86% | 43.44% | 28.91% |
| 3-Year Return | 36.87% | 51.81% | 31.74% |
| 5-Year Return | 268.87% | 185.77% | 94.03% |
| 10-Year Return | 975.82% | 571.16% | 241.17% |
| Sep '19 | Sep '20 | Sep '21 | Sep '22 | Sep '23 | 5YR TREND | |
|---|---|---|---|---|---|---|
| Total Revenue | 260.17B | 274.51B | 365.82B | 394.33B | 383.29B | [{"date":"2019-09-30","value":65.98,"profit":true},{"date":"2020-09-30","value":69.62,"profit":true},{"date":"2021-09-30","value":92.77,"profit":true},{"date":"2022-09-30","value":100,"profit":true},{"date":"2023-09-30","value":97.2,"profit":true}] |
| Cost of Revenue | 161.78B | 169.56B | 212.98B | 223.55B | 214.14B | [{"date":"2019-09-30","value":72.37,"profit":true},{"date":"2020-09-30","value":75.85,"profit":true},{"date":"2021-09-30","value":95.27,"profit":true},{"date":"2022-09-30","value":100,"profit":true},{"date":"2023-09-30","value":95.79,"profit":true}] |
| Gross Profit | 98.39B | 104.96B | 152.84B | 170.78B | 169.15B | [{"date":"2019-09-30","value":57.61,"profit":true},{"date":"2020-09-30","value":61.46,"profit":true},{"date":"2021-09-30","value":89.49,"profit":true},{"date":"2022-09-30","value":100,"profit":true},{"date":"2023-09-30","value":99.04,"profit":true}] |
| Gross Margin | 37.82% | 38.23% | 41.78% | 43.31% | 44.13% | [{"date":"2019-09-30","value":85.69,"profit":true},{"date":"2020-09-30","value":86.64,"profit":true},{"date":"2021-09-30","value":94.67,"profit":true},{"date":"2022-09-30","value":98.14,"profit":true},{"date":"2023-09-30","value":100,"profit":true}] |
| Operating Expenses | 34.46B | 38.67B | 43.89B | 51.34B | 54.85B | [{"date":"2019-09-30","value":62.83,"profit":true},{"date":"2020-09-30","value":70.5,"profit":true},{"date":"2021-09-30","value":80.02,"profit":true},{"date":"2022-09-30","value":93.61,"profit":true},{"date":"2023-09-30","value":100,"profit":true}] |
| Operating Income | 63.93B | 66.29B | 108.95B | 119.44B | 114.30B | [{"date":"2019-09-30","value":53.53,"profit":true},{"date":"2020-09-30","value":55.5,"profit":true},{"date":"2021-09-30","value":91.22,"profit":true},{"date":"2022-09-30","value":100,"profit":true},{"date":"2023-09-30","value":95.7,"profit":true}] |
| Total Non-Operating Income/Expense | 3.19B | 1.69B | 456.00M | (440.00M) | (748.00M) | [{"date":"2019-09-30","value":100,"profit":true},{"date":"2020-09-30","value":53.04,"profit":true},{"date":"2021-09-30","value":14.29,"profit":true},{"date":"2022-09-30","value":-13.78,"profit":false},{"date":"2023-09-30","value":-23.43,"profit":false}] |
| Pre-Tax Income | 65.74B | 67.09B | 109.21B | 119.10B | 113.74B | [{"date":"2019-09-30","value":55.19,"profit":true},{"date":"2020-09-30","value":56.33,"profit":true},{"date":"2021-09-30","value":91.69,"profit":true},{"date":"2022-09-30","value":100,"profit":true},{"date":"2023-09-30","value":95.49,"profit":true}] |
| Income Taxes | 10.48B | 9.68B | 14.53B | 19.30B | 16.74B | [{"date":"2019-09-30","value":54.31,"profit":true},{"date":"2020-09-30","value":50.16,"profit":true},{"date":"2021-09-30","value":75.27,"profit":true},{"date":"2022-09-30","value":100,"profit":true},{"date":"2023-09-30","value":86.74,"profit":true}] |
| Income After Taxes | 55.26B | 57.41B | 94.68B | 99.80B | 97.00B | [{"date":"2019-09-30","value":55.37,"profit":true},{"date":"2020-09-30","value":57.52,"profit":true},{"date":"2021-09-30","value":94.87,"profit":true},{"date":"2022-09-30","value":100,"profit":true},{"date":"2023-09-30","value":97.19,"profit":true}] |
| Income From Continuous Operations | 55.26B | 57.41B | 94.68B | 99.80B | 97.00B | [{"date":"2019-09-30","value":55.37,"profit":true},{"date":"2020-09-30","value":57.52,"profit":true},{"date":"2021-09-30","value":94.87,"profit":true},{"date":"2022-09-30","value":100,"profit":true},{"date":"2023-09-30","value":97.19,"profit":true}] |
| Income From Discontinued Operations | - | - | - | - | - | [{"date":"2019-09-30","value":"-","profit":true},{"date":"2020-09-30","value":"-","profit":true},{"date":"2021-09-30","value":"-","profit":true},{"date":"2022-09-30","value":"-","profit":true},{"date":"2023-09-30","value":"-","profit":true}] |
| Net Income | 55.26B | 57.41B | 94.68B | 99.80B | 97.00B | [{"date":"2019-09-30","value":55.37,"profit":true},{"date":"2020-09-30","value":57.52,"profit":true},{"date":"2021-09-30","value":94.87,"profit":true},{"date":"2022-09-30","value":100,"profit":true},{"date":"2023-09-30","value":97.19,"profit":true}] |
| EPS (Diluted) | 2.98 | 3.27 | 5.62 | 6.11 | 6.12 | [{"date":"2019-09-30","value":48.69,"profit":true},{"date":"2020-09-30","value":53.43,"profit":true},{"date":"2021-09-30","value":91.83,"profit":true},{"date":"2022-09-30","value":99.84,"profit":true},{"date":"2023-09-30","value":100,"profit":true}] |
These ratios help you determine the liquidity of the company. Higher is better.
| AAPL | |
|---|---|
| Cash Ratio | 0.55 |
| Current Ratio | 1.07 |
| Quick Ratio | 1.02 |
These ratios help you understand the company's efficiency in using its assets to generate returns. Higher is better. For ROE, average long term is around 14%, less than 10% is poor.
| AAPL | |
|---|---|
| ROA (LTM) | 21.18% |
| ROE (LTM) | 154.27% |
These ratios help you understand the company's liabilities, gauging the riskiness of the investment.
| AAPL | |
|---|---|
| Debt Ratio Lower is generally better. Negative is bad. | 0.79 |
| Common Equity/Total Assets Higher is better. Lower can suggest investment is riskier. | 0.21 |
| Debt/Equity The higher the number, the more leverage the business employs, the riskier the investment typically is. | 4.77 |
These ratios help you understand the company's valuation. Lower may indicate cheaper stocks.
| AAPL | |
|---|---|
| Trailing PE | 27.26 |
| Forward PE | 26.81 |
| P/S (TTM) | 7.01 |
| P/B | 36.47 |
| Price/FCF | 72 |
| EV/R | 7.10 |
| EV/Ebitda | 20.51 |
| PEG | 2.92 |

Apple Inc.''s worldwide shipments of iPhones dropped 9.6% on an annual level, the International Data Corporation''s (IDC) data showed on Monday.More to come…...
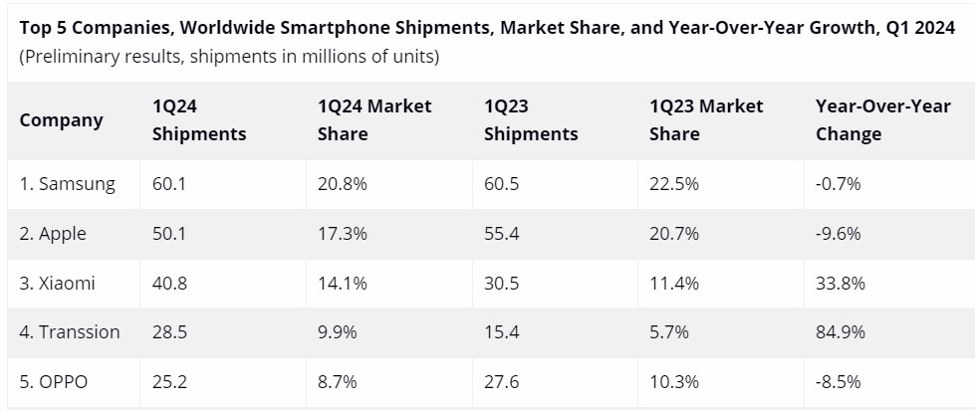
The broader smartphone rebounded. Apple lagging. The table comes from the IDC repor t: global smartphone shipments increased 7.8% year over year in the first quarter of 2024 While the industry is not completely out of the woods, as macroeconomic challenges remain in many markets, this marks the third consecutive quarter of shipment growth, a strong indicator that a recovery is well underway. This article was written by Eamonn Sheridan at www.forexlive.com.

Image: OnLeaks / 91Mobiles Google could be adding a feature very similar to Apple’s Emergency SOS feature to the Pixel 9 and the next Pixel Fold . That’s according to leaker Kamila Wojciechowska, who writes for Android Authority that the company would partner with T-Mobile to offer the feature but may add other providers later. Just like Apple’s system, Google’s SOS feature would reportedly present future Pixel owners with a series of questions to ascertain what’s happening, rather than let users thumb one out. A video in the Android Authority article features the animation Google will display to users to help them get the phone aligned with a satellite. According to Wojciechowska, these are some of the questions the feature will ask: What happened? [Are you/Are they/Is everyone] breathing? In total, how many people are [missing/trapped]? What best describes your situation? What is on fire? Are there weapons involved? What type of vehicle or vessel? Do any of these apply? T-Mobile announced it was teaming up with SpaceX for a satellite messaging service well over a year ago but didn’t specify pricing — and as of January, it was still in testing .
When it comes to successful brands in America, the list of big names seems to rarely ever change. If it seems like names like Apple, Google, and Amazon are the names we hear the most, it’s because they are often the ones most associated with growth. Thankfully, Yelp is hoping to change this mindset with […] The post You Probably Don’t Know The Brands Taking Over America in 2024 appeared first on 24/7 Wall St. .

WebProNews UK App Developer Lawsuit Against Apple Moves Forward Apple has lost its bid to dismiss a lawsuit on behalf of more than 1,500 UK app developers, a suit that seeks $1 billion in damages. UK App Developer Lawsuit Against Apple Moves Forward Matt Milano

After Apple changed its policy allowing gaming emulators from third party developers on the App Store, the first ones have started to show up.


Apple is reportedly gearing up for a comprehensive overhaul of its Mac lineup, including the MacBook, iMac, and Mac mini, with a particular focus on artificial intelligence enhancements. In a recent report by Bloomberg’s Mark Gurman, it’s stated that Apple is nearing the start of production for its M4 processor, which will be at the […] This article, Apple to overhaul its entire Mac lineup with AI-powered M4 chips , was originally published at NoypiGeeks | Philippines Technology News, Reviews and How to''s.

The iPhone maker denies violating a court order to give developers greater freedom to guide app users to alternative payment methods for digital goods

Wall Street analysts and the Club see artificial intelligence as a key driver of investor enthusiasm and the next upgrade cycle.
Apple Inc (AAPL) share price today is $176.55
Yes, Indians can buy shares of Apple Inc (AAPL) on Vested. To buy Apple Inc from India, you can open a US Brokerage account on Vested today by clicking on Sign Up or Invest in AAPL stock at the top of this page. The account opening process is completely digital and secure, and takes a few minutes to complete.
Yes, you can purchase fractional shares of Apple Inc (AAPL) via the Vested app. You can start investing in Apple Inc (AAPL) with a minimum investment of $1.
You can invest in shares of Apple Inc (AAPL) via Vested in three simple steps:
The 52-week high price of Apple Inc (AAPL) is $199.37. The 52-week low price of Apple Inc (AAPL) is $161.94.
The price-to-earnings (P/E) ratio of Apple Inc (AAPL) is 27.51
The price-to-book (P/B) ratio of Apple Inc (AAPL) is 36.47
The dividend yield of Apple Inc (AAPL) is 0.55%
The market capitalization of Apple Inc (AAPL) is $2.73T
The stock symbol (or ticker) of Apple Inc is AAPL
 Link copied


