

Invest in 5,000+ US Stocks and ETFs
* Offering through VF Securities, Inc. (member FINRA/SIPC)
 Skip to content
ASML Holding N.V. develops, produces, markets, sells, and services advanced semiconductor equipment systems for chipmakers. It offers advanced semiconductor equipment systems, including lithography, metrology, and inspection systems. The company also provides extreme ultraviolet lithography systems; and deep ultraviolet lithography systems comprising immersion and dry lithography solutions to manufacture various range of semiconductor nodes and technologies. In addition, it offers metrology and inspection systems, including YieldStar optical metrology systems to assess the quality of patterns on the wafers; and HMI electron beam solutions to locate and analyze individual chip defects. Further, the company provides computational lithography solutions, and lithography systems and control software solutions; and refurbishes and upgrades lithography systems, as well as offers customer support and related services. It operates in Japan, South Korea, Singapore, Taiwan, China, rest of Asia, the Netherlands, rest of Europe, the Middle East, Africa, and the United States. The company was formerly known as ASM Lithography Holding N.V. and changed its name to ASML Holding N.V. in 2001. ASML Holding N.V. was founded in 1984 and is headquartered in Veldhoven, the Netherlands. more
| Time Frame | ASML | Sector | S&P500 |
|---|---|---|---|
| 1-Week Return | -4.22% | -0.89% | -0.66% |
| 1-Month Return | -13.93% | -6.02% | -3.88% |
| 3-Month Return | -3.86% | -1.79% | 2.95% |
| 6-Month Return | 40.75% | 17.85% | 19.68% |
| 1-Year Return | 35.43% | 31.11% | 22.69% |
| 3-Year Return | 34.16% | 44.52% | 25.69% |
| 5-Year Return | 332.34% | 162.81% | 86.97% |
| 10-Year Return | 1052.78% | 514.63% | 221.1% |
| Dec '19 | Dec '20 | Dec '21 | Dec '22 | Dec '23 | 5YR TREND | |
|---|---|---|---|---|---|---|
| Total Revenue | 11.82B | 13.98B | 18.61B | 21.17B | 27.56B | [{"date":"2019-12-31","value":42.89,"profit":true},{"date":"2020-12-31","value":50.72,"profit":true},{"date":"2021-12-31","value":67.53,"profit":true},{"date":"2022-12-31","value":76.83,"profit":true},{"date":"2023-12-31","value":100,"profit":true}] |
| Cost of Revenue | 6.92B | 7.18B | 8.80B | 10.66B | 13.42B | [{"date":"2019-12-31","value":51.55,"profit":true},{"date":"2020-12-31","value":53.5,"profit":true},{"date":"2021-12-31","value":65.58,"profit":true},{"date":"2022-12-31","value":79.42,"profit":true},{"date":"2023-12-31","value":100,"profit":true}] |
| Gross Profit | 4.90B | 6.80B | 9.81B | 10.51B | 14.14B | [{"date":"2019-12-31","value":34.66,"profit":true},{"date":"2020-12-31","value":48.08,"profit":true},{"date":"2021-12-31","value":69.39,"profit":true},{"date":"2022-12-31","value":74.37,"profit":true},{"date":"2023-12-31","value":100,"profit":true}] |
| Gross Margin | 41.46% | 48.63% | 52.71% | 49.65% | 51.29% | [{"date":"2019-12-31","value":78.66,"profit":true},{"date":"2020-12-31","value":92.26,"profit":true},{"date":"2021-12-31","value":100,"profit":true},{"date":"2022-12-31","value":94.2,"profit":true},{"date":"2023-12-31","value":97.32,"profit":true}] |
| Operating Expenses | 2.18B | 2.75B | 3.27B | 3.19B | 5.09B | [{"date":"2019-12-31","value":42.86,"profit":true},{"date":"2020-12-31","value":53.9,"profit":true},{"date":"2021-12-31","value":64.25,"profit":true},{"date":"2022-12-31","value":62.66,"profit":true},{"date":"2023-12-31","value":100,"profit":true}] |
| Operating Income | 2.72B | 4.05B | 6.75B | 7.32B | 9.04B | [{"date":"2019-12-31","value":30.04,"profit":true},{"date":"2020-12-31","value":44.81,"profit":true},{"date":"2021-12-31","value":74.65,"profit":true},{"date":"2022-12-31","value":80.96,"profit":true},{"date":"2023-12-31","value":100,"profit":true}] |
| Total Non-Operating Income/Expense | (50.00M) | (69.80M) | (89.20M) | (89.20M) | 82.40M | [{"date":"2019-12-31","value":-60.68,"profit":false},{"date":"2020-12-31","value":-84.71,"profit":false},{"date":"2021-12-31","value":-108.25,"profit":false},{"date":"2022-12-31","value":-108.25,"profit":false},{"date":"2023-12-31","value":100,"profit":true}] |
| Pre-Tax Income | 2.69B | 4.02B | 6.71B | 7.28B | 9.08B | [{"date":"2019-12-31","value":29.63,"profit":true},{"date":"2020-12-31","value":44.22,"profit":true},{"date":"2021-12-31","value":73.82,"profit":true},{"date":"2022-12-31","value":80.11,"profit":true},{"date":"2023-12-31","value":100,"profit":true}] |
| Income Taxes | 128.80M | 551.50M | 1.02B | 1.02B | 1.44B | [{"date":"2019-12-31","value":8.97,"profit":true},{"date":"2020-12-31","value":38.41,"profit":true},{"date":"2021-12-31","value":71.14,"profit":true},{"date":"2022-12-31","value":70.94,"profit":true},{"date":"2023-12-31","value":100,"profit":true}] |
| Income After Taxes | 2.56B | 3.47B | 5.68B | 6.26B | 7.65B | [{"date":"2019-12-31","value":33.51,"profit":true},{"date":"2020-12-31","value":45.31,"profit":true},{"date":"2021-12-31","value":74.32,"profit":true},{"date":"2022-12-31","value":81.83,"profit":true},{"date":"2023-12-31","value":100,"profit":true}] |
| Income From Continuous Operations | 2.57B | 3.47B | 5.68B | 5.49B | 7.84B | [{"date":"2019-12-31","value":32.84,"profit":true},{"date":"2020-12-31","value":44.2,"profit":true},{"date":"2021-12-31","value":72.51,"profit":true},{"date":"2022-12-31","value":69.99,"profit":true},{"date":"2023-12-31","value":100,"profit":true}] |
| Income From Discontinued Operations | - | - | - | - | - | [{"date":"2019-12-31","value":"-","profit":true},{"date":"2020-12-31","value":"-","profit":true},{"date":"2021-12-31","value":"-","profit":true},{"date":"2022-12-31","value":"-","profit":true},{"date":"2023-12-31","value":"-","profit":true}] |
| Net Income | 2.58B | 3.55B | 5.88B | 5.62B | 7.84B | [{"date":"2019-12-31","value":32.93,"profit":true},{"date":"2020-12-31","value":45.33,"profit":true},{"date":"2021-12-31","value":75.05,"profit":true},{"date":"2022-12-31","value":71.75,"profit":true},{"date":"2023-12-31","value":100,"profit":true}] |
| EPS (Diluted) | 6.90 | 9.81 | 16.93 | 14.73 | 20.25 | [{"date":"2019-12-31","value":34.07,"profit":true},{"date":"2020-12-31","value":48.44,"profit":true},{"date":"2021-12-31","value":83.6,"profit":true},{"date":"2022-12-31","value":72.74,"profit":true},{"date":"2023-12-31","value":100,"profit":true}] |
These ratios help you determine the liquidity of the company. Higher is better.
| ASML | |
|---|---|
| Cash Ratio | 0.36 |
| Current Ratio | 1.54 |
| Quick Ratio | 0.88 |
These ratios help you understand the company's efficiency in using its assets to generate returns. Higher is better. For ROE, average long term is around 14%, less than 10% is poor.
| ASML | |
|---|---|
| ROA (LTM) | 13.86% |
| ROE (LTM) | 60.28% |
These ratios help you understand the company's liabilities, gauging the riskiness of the investment.
| ASML | |
|---|---|
| Debt Ratio Lower is generally better. Negative is bad. | 0.65 |
| Common Equity/Total Assets Higher is better. Lower can suggest investment is riskier. | 0.35 |
| Debt/Equity The higher the number, the more leverage the business employs, the riskier the investment typically is. | 2.83 |
These ratios help you understand the company's valuation. Lower may indicate cheaper stocks.
| ASML | |
|---|---|
| Trailing PE | 45.04 |
| Forward PE | 44.05 |
| P/S (TTM) | 13.98 |
| P/B | 26.27 |
| Price/FCF | NM |
| EV/R | 13.85 |
| EV/Ebitda | 38.25 |
| PEG | 6.27 |

The boom is on for chip buyers and sellers, but demand is lighter further up the supply chain. And United Airlines results show the skies look friendly for airline stocks.

If you’re searching for stocks to outperform the S&P 500 , look no further. Some stocks are more solid than others against market downturns and macro-economic uncertainty and have high chances of beating the S&P 500 index. Three of these stocks are listed here because of their fundamental resilience to market turbulence and their track record of steady performance. These companies have a lead across industries, including technology, healthcare, and consumer staples. They have certain traits that make them appealing investment choices during trying times. The first demonstrates a substantial increase in organic sales throughout various geographic areas. This indicates consistent customer demand and successful marketing tactics. The second one is impressive due to its cutting-edge pharmaceutical section. This shows significant income streams and encourages development potential in therapeutic areas like cancer. Significant order bookings were made for the third one. This demonstrates the high demand for its cutting-edge lithography technique and offers future revenue predictability.

At one point Nvidia (NASDAQ: NVDA ) stock was in official correction territory. Shares were down more than 20% on fears of a slowing artificial intelligence ( AI ) chip market. Not that the fears had any basis in fact. It was only because Super Micro Computer (NASDAQ: SMCI ) failed to provide preliminary financial results when announcing its earnings release date that caused the stock to slide. It indicated that investors were worried about Nvidia’s valuation. Having come so far so fast, the chipmaker was trading at nosebleed valuations. At such times, any sort of tremor in the marketplace can shake an overvalued stock’s foundation’s. Although Nvidia stock has mostly bounced back, up about 13%, it still has a ways to go before reaching a new, all-time high. Also, it means investors might bail on it again at a moment’s notice. You may want to protect your downside by seeking out new AI stocks to grab now. Because the chipmaker’s stock still carries lofty valuations, consider the three stocks below to make a windfall.

The company has taken quite a few hits to its shares after reporting first-quarter results.

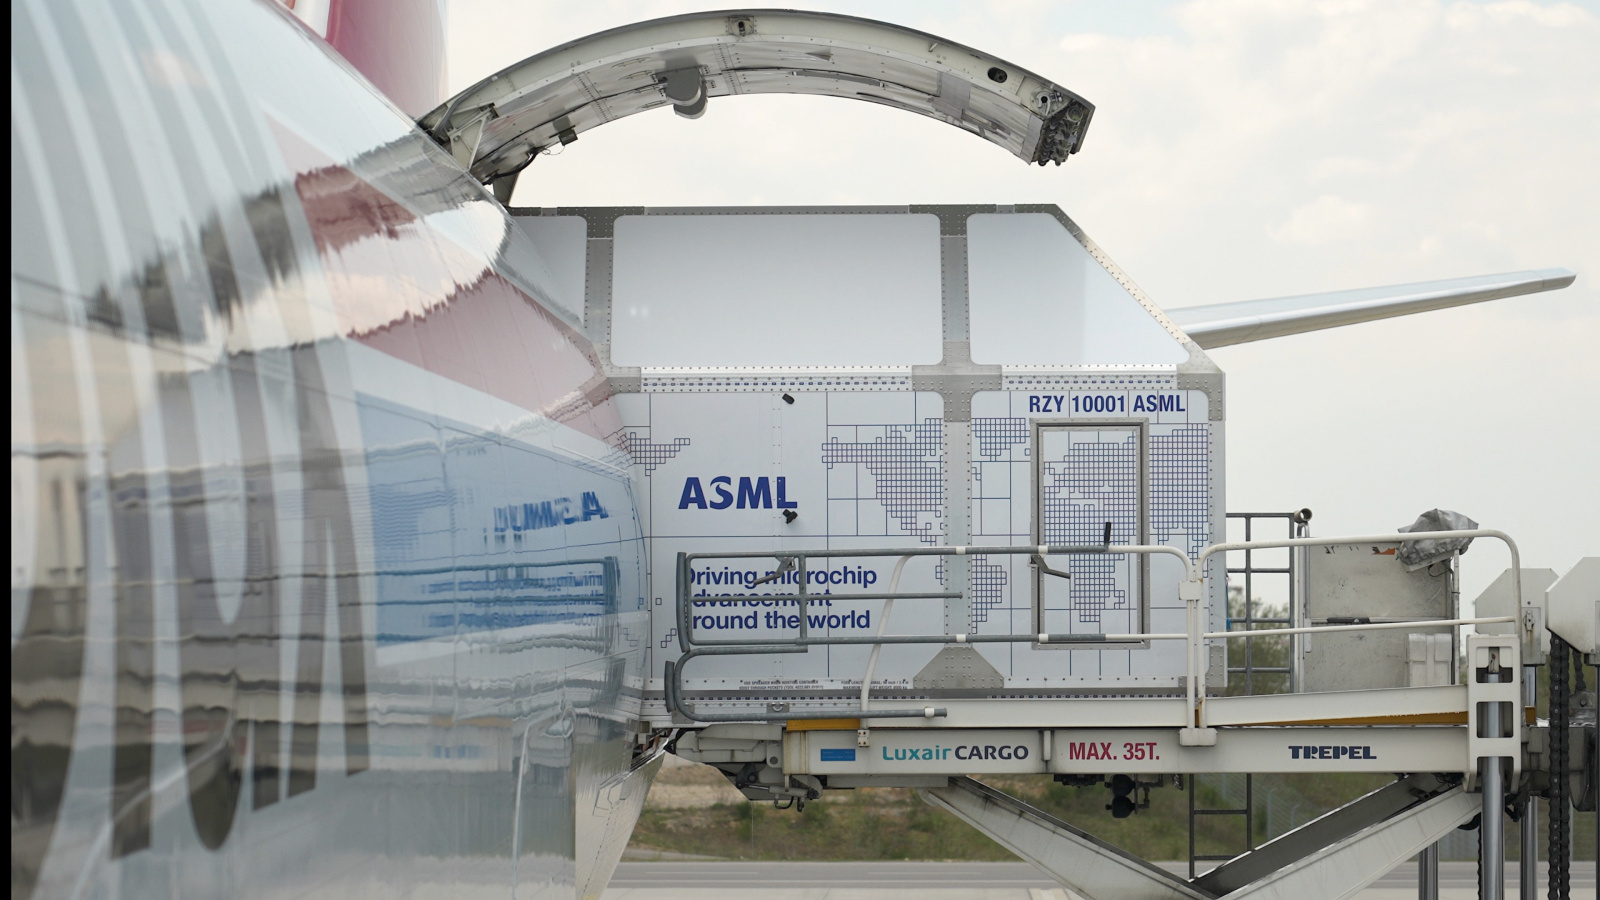
ASML is a key supplier for all chip manufacturers.

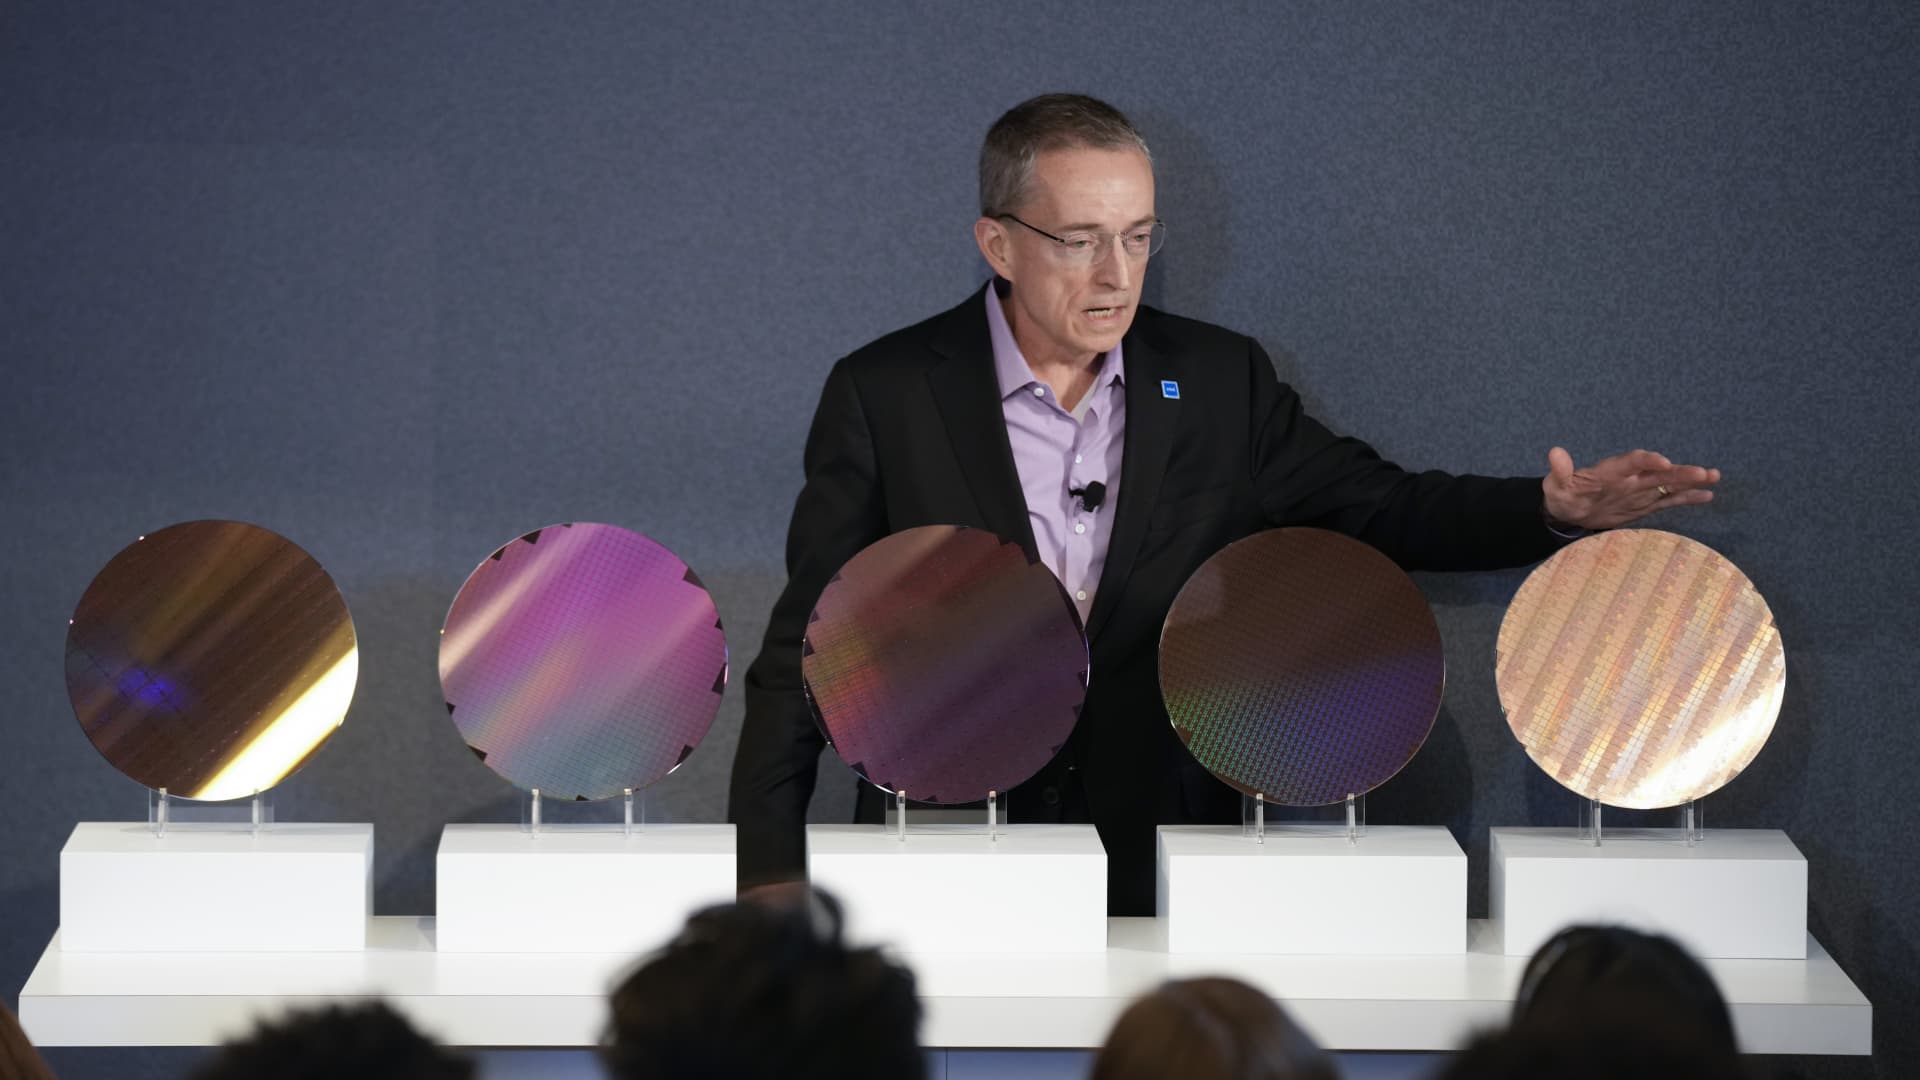
While the broader stock market can often be unpredictable, investors continue their search for unstoppable tech stocks for big gains in 2024. Among the top contenders are companies harnessing the power of artificial intelligence, renewable energy and e-commerce. Often characterized by their significant growth potential and established market positioning, these tech giants demonstrate an unwavering ability to thrive in the face of adversity. Moreover, they have a sound track record of reporting strong revenue and earnings growth over the years. As the digital revolution accelerates, these top unstoppable tech stocks will continue to shape the future. Now, here are the top three unstoppable tech stocks for big gains in 2024! ASML Holding (ASML) Source: Ralf Liebhold / Shutterstock ASML Holding (NASDAQ: ASML ) is a Dutch company with a unique footing and dominance in a critical part of the semiconductor industry. They manufacture extreme ultraviolet (EUV) lithography systems, a complex technology essential for producing cutting-edge chips for smartphones, computers and AI applications.

Data analytics company GlobalData projects that the AI market will grow 35% annually over the next few years, reaching $909 billion by 2030. Naturally, that’s made AI chip stocks extremely popular with investors. Google the words “AI chip stocks” in quotation marks, and you will get 39,600 results. AI is undoubtedly a priority subject for investors at the moment. On April 1, Barron’s reported that Microsoft (NASDAQ: MSFT ) and OpenAI plan to build a $100 billion AI data center, an investment equal to Microsoft’s capital spending over the past four years. Investors are stocked because the AI chips required to power such a large data center would be enormous. That’s good news for Nvidia (NASDAQ: NVDA ) and every other major AI player. Bank of America’s Global Research analyst Vivek Arya has buy ratings on Nvidia and four other AI chip stocks. I’d normally include Nvidia in any AI-related recommendation, but I’ll go with three that he does not mention in his article. To make my selection, I looked at the Horizons Global Semiconductor Index ETF’s holdings, which trade on the Toronto Stock Exchange.
Analysts on Wall Street often ask insightful questions that get companies to reveal critical information for investors.
ASML Holding NV ADR (ASML) share price today is $852.84
Yes, Indians can buy shares of ASML Holding NV ADR (ASML) on Vested. To buy ASML Holding NV ADR from India, you can open a US Brokerage account on Vested today by clicking on Sign Up or Invest in ASML stock at the top of this page. The account opening process is completely digital and secure, and takes a few minutes to complete.
Yes, you can purchase fractional shares of ASML Holding NV ADR (ASML) via the Vested app. You can start investing in ASML Holding NV ADR (ASML) with a minimum investment of $1.
You can invest in shares of ASML Holding NV ADR (ASML) via Vested in three simple steps:
The 52-week high price of ASML Holding NV ADR (ASML) is $1054.12. The 52-week low price of ASML Holding NV ADR (ASML) is $560.39.
The price-to-earnings (P/E) ratio of ASML Holding NV ADR (ASML) is 43.71
The price-to-book (P/B) ratio of ASML Holding NV ADR (ASML) is 26.27
The dividend yield of ASML Holding NV ADR (ASML) is 0.76%
The market capitalization of ASML Holding NV ADR (ASML) is $348.63B
The stock symbol (or ticker) of ASML Holding NV ADR is ASML
 Link copied


