

Invest in 5,000+ US Stocks and ETFs
* Offering through VF Securities, Inc. (member FINRA/SIPC)
 Skip to content
ASML Holding N.V. develops, produces, markets, sells, and services advanced semiconductor equipment systems for chipmakers. It offers advanced semiconductor equipment systems, including lithography, metrology, and inspection systems. The company also provides extreme ultraviolet lithography systems; and deep ultraviolet lithography systems comprising immersion and dry lithography solutions to manufacture various range of semiconductor nodes and technologies. In addition, it offers metrology and inspection systems, including YieldStar optical metrology systems to assess the quality of patterns on the wafers; and HMI electron beam solutions to locate and analyze individual chip defects. Further, the company provides computational lithography solutions, and lithography systems and control software solutions; and refurbishes and upgrades lithography systems, as well as offers customer support and related services. It operates in Japan, South Korea, Singapore, Taiwan, China, rest of Asia, the Netherlands, rest of Europe, the Middle East, Africa, and the United States. The company was formerly known as ASM Lithography Holding N.V. and changed its name to ASML Holding N.V. in 2001. ASML Holding N.V. was founded in 1984 and is headquartered in Veldhoven, the Netherlands. more
| Time Frame | ASML | Sector | S&P500 |
|---|---|---|---|
| 1-Week Return | 2.85% | 1.71% | 1.18% |
| 1-Month Return | -1.62% | 3.38% | 3.76% |
| 3-Month Return | 1.03% | 2.07% | 4.59% |
| 6-Month Return | 38.8% | 14.74% | 17.3% |
| 1-Year Return | 44.21% | 38% | 28.69% |
| 3-Year Return | 51.9% | 58.33% | 31.86% |
| 5-Year Return | 388.86% | 190.86% | 99.56% |
| 10-Year Return | 1177.55% | 553.14% | 236.56% |
| Dec '19 | Dec '20 | Dec '21 | Dec '22 | Dec '23 | 5YR TREND | |
|---|---|---|---|---|---|---|
| Total Revenue | 11.82B | 13.98B | 18.61B | 21.17B | 27.56B | [{"date":"2019-12-31","value":42.89,"profit":true},{"date":"2020-12-31","value":50.72,"profit":true},{"date":"2021-12-31","value":67.53,"profit":true},{"date":"2022-12-31","value":76.83,"profit":true},{"date":"2023-12-31","value":100,"profit":true}] |
| Cost of Revenue | 6.92B | 7.18B | 8.80B | 10.66B | 13.42B | [{"date":"2019-12-31","value":51.55,"profit":true},{"date":"2020-12-31","value":53.5,"profit":true},{"date":"2021-12-31","value":65.58,"profit":true},{"date":"2022-12-31","value":79.42,"profit":true},{"date":"2023-12-31","value":100,"profit":true}] |
| Gross Profit | 4.90B | 6.80B | 9.81B | 10.51B | 14.14B | [{"date":"2019-12-31","value":34.66,"profit":true},{"date":"2020-12-31","value":48.08,"profit":true},{"date":"2021-12-31","value":69.39,"profit":true},{"date":"2022-12-31","value":74.37,"profit":true},{"date":"2023-12-31","value":100,"profit":true}] |
| Gross Margin | 41.46% | 48.63% | 52.71% | 49.65% | 51.29% | [{"date":"2019-12-31","value":78.66,"profit":true},{"date":"2020-12-31","value":92.26,"profit":true},{"date":"2021-12-31","value":100,"profit":true},{"date":"2022-12-31","value":94.2,"profit":true},{"date":"2023-12-31","value":97.32,"profit":true}] |
| Operating Expenses | 2.18B | 2.75B | 3.27B | 3.19B | 5.09B | [{"date":"2019-12-31","value":42.86,"profit":true},{"date":"2020-12-31","value":53.9,"profit":true},{"date":"2021-12-31","value":64.25,"profit":true},{"date":"2022-12-31","value":62.66,"profit":true},{"date":"2023-12-31","value":100,"profit":true}] |
| Operating Income | 2.72B | 4.05B | 6.75B | 7.32B | 9.04B | [{"date":"2019-12-31","value":30.04,"profit":true},{"date":"2020-12-31","value":44.81,"profit":true},{"date":"2021-12-31","value":74.65,"profit":true},{"date":"2022-12-31","value":80.96,"profit":true},{"date":"2023-12-31","value":100,"profit":true}] |
| Total Non-Operating Income/Expense | (50.00M) | (69.80M) | (89.20M) | (89.20M) | 82.40M | [{"date":"2019-12-31","value":-60.68,"profit":false},{"date":"2020-12-31","value":-84.71,"profit":false},{"date":"2021-12-31","value":-108.25,"profit":false},{"date":"2022-12-31","value":-108.25,"profit":false},{"date":"2023-12-31","value":100,"profit":true}] |
| Pre-Tax Income | 2.69B | 4.02B | 6.71B | 7.28B | 9.08B | [{"date":"2019-12-31","value":29.63,"profit":true},{"date":"2020-12-31","value":44.22,"profit":true},{"date":"2021-12-31","value":73.82,"profit":true},{"date":"2022-12-31","value":80.11,"profit":true},{"date":"2023-12-31","value":100,"profit":true}] |
| Income Taxes | 128.80M | 551.50M | 1.02B | 1.02B | 1.44B | [{"date":"2019-12-31","value":8.97,"profit":true},{"date":"2020-12-31","value":38.41,"profit":true},{"date":"2021-12-31","value":71.14,"profit":true},{"date":"2022-12-31","value":70.94,"profit":true},{"date":"2023-12-31","value":100,"profit":true}] |
| Income After Taxes | 2.56B | 3.47B | 5.68B | 6.26B | 7.65B | [{"date":"2019-12-31","value":33.51,"profit":true},{"date":"2020-12-31","value":45.31,"profit":true},{"date":"2021-12-31","value":74.32,"profit":true},{"date":"2022-12-31","value":81.83,"profit":true},{"date":"2023-12-31","value":100,"profit":true}] |
| Income From Continuous Operations | 2.57B | 3.47B | 5.68B | 5.49B | 7.84B | [{"date":"2019-12-31","value":32.84,"profit":true},{"date":"2020-12-31","value":44.2,"profit":true},{"date":"2021-12-31","value":72.51,"profit":true},{"date":"2022-12-31","value":69.99,"profit":true},{"date":"2023-12-31","value":100,"profit":true}] |
| Income From Discontinued Operations | - | - | - | - | - | [{"date":"2019-12-31","value":"-","profit":true},{"date":"2020-12-31","value":"-","profit":true},{"date":"2021-12-31","value":"-","profit":true},{"date":"2022-12-31","value":"-","profit":true},{"date":"2023-12-31","value":"-","profit":true}] |
| Net Income | 2.58B | 3.55B | 5.88B | 5.62B | 7.84B | [{"date":"2019-12-31","value":32.93,"profit":true},{"date":"2020-12-31","value":45.33,"profit":true},{"date":"2021-12-31","value":75.05,"profit":true},{"date":"2022-12-31","value":71.75,"profit":true},{"date":"2023-12-31","value":100,"profit":true}] |
| EPS (Diluted) | 6.90 | 9.81 | 16.93 | 14.73 | 20.60 | [{"date":"2019-12-31","value":33.5,"profit":true},{"date":"2020-12-31","value":47.62,"profit":true},{"date":"2021-12-31","value":82.18,"profit":true},{"date":"2022-12-31","value":71.5,"profit":true},{"date":"2023-12-31","value":100,"profit":true}] |
These ratios help you determine the liquidity of the company. Higher is better.
| ASML | |
|---|---|
| Cash Ratio | 0.36 |
| Current Ratio | 1.54 |
| Quick Ratio | 0.88 |
These ratios help you understand the company's efficiency in using its assets to generate returns. Higher is better. For ROE, average long term is around 14%, less than 10% is poor.
| ASML | |
|---|---|
| ROA (LTM) | 13.86% |
| ROE (LTM) | 60.28% |
These ratios help you understand the company's liabilities, gauging the riskiness of the investment.
| ASML | |
|---|---|
| Debt Ratio Lower is generally better. Negative is bad. | 0.65 |
| Common Equity/Total Assets Higher is better. Lower can suggest investment is riskier. | 0.35 |
| Debt/Equity The higher the number, the more leverage the business employs, the riskier the investment typically is. | 2.83 |
These ratios help you understand the company's valuation. Lower may indicate cheaper stocks.
| ASML | |
|---|---|
| Trailing PE | 46.95 |
| Forward PE | 44.05 |
| P/S (TTM) | 13.98 |
| P/B | 26.27 |
| Price/FCF | NM |
| EV/R | 13.85 |
| EV/Ebitda | 38.25 |
| PEG | 6.58 |

Mark Hillman''s Strategic Exits and Acquisitions in Q1 2024: Spotlight on ASML Holding NV

ASML Holding NV’s new advanced chip machines have a daunting price tag, according to Taiwan Semiconductor Manufacturing Co., one of the Dutch company’s biggest clients.

Steve Weiss, founder and ,anaging partner at Short Hills Capital Partners joins CNBCs Halftime Report to detail his latest buys in ASML and Netflix.
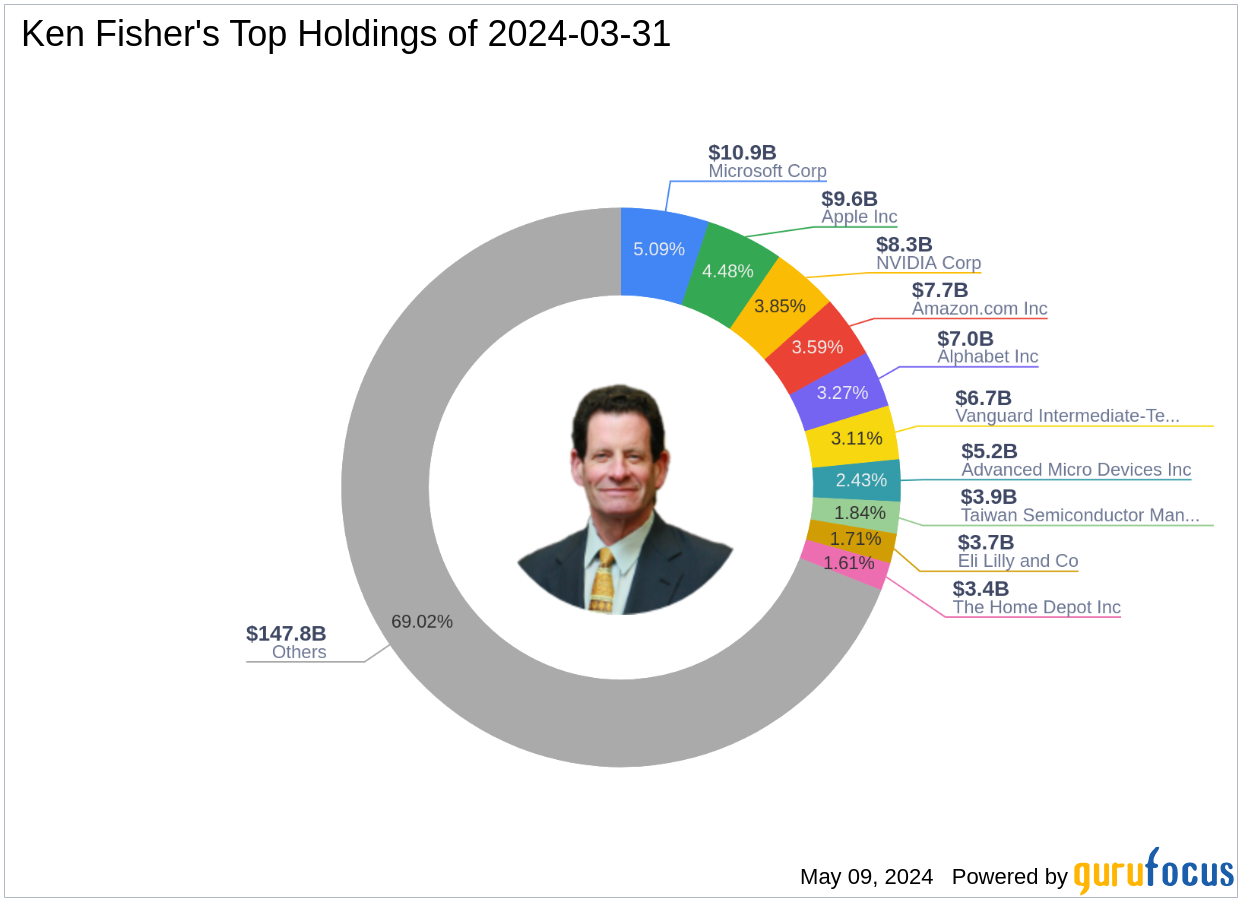
Ken Fisher''s Strategic Moves in Q1 2024: A Closer Look at ASML Holding NV

ASML is a monopoly in the true sense of the word. The $360 billion Dutch company faces no meaningful competition selling machines that manufacture the world’s most advanced semiconductors. But as new Chief Executive Christophe Fouquet takes over, his predecessor Peter Wennink leaves behind challenges as well as strengths.

Which of these tech giants is the better investment right now?
Chip stocks pulled back following an earnings report by ASML (NASDAQ: ASML ), a prominent semiconductor manufacturing equipment developer, which said it expects its bookings to see a significant 61% sequential decrease in the first quarter. This downturn surpassed what investors had anticipated, causing concern in the semiconductor market. This slowdown in equipment purchases by foundries, that manufacture chips for companies such as Nvidia (NASDAQ: NVDA ) and Apple (NASDAQ: AAPL ) could indicate a potential downturn in the semiconductor industry, which is what is hurting chip stocks lately. The semiconductor sector was further shaken by a global retreat in semiconductor stocks , prompted by profit-taking after TSMC revised its chip market growth forecast downwards. The revision by TSMC, from over 10% to 10% growth for the global logic semiconductor industry, is fueling concerns over the demand for chips used in various technologies including electric vehicles, computers, and smartphones.
ASML Holding NV ADR (ASML) share price today is $937.42
Yes, Indians can buy shares of ASML Holding NV ADR (ASML) on Vested. To buy ASML Holding NV ADR from India, you can open a US Brokerage account on Vested today by clicking on Sign Up or Invest in ASML stock at the top of this page. The account opening process is completely digital and secure, and takes a few minutes to complete.
Yes, you can purchase fractional shares of ASML Holding NV ADR (ASML) via the Vested app. You can start investing in ASML Holding NV ADR (ASML) with a minimum investment of $1.
You can invest in shares of ASML Holding NV ADR (ASML) via Vested in three simple steps:
The 52-week high price of ASML Holding NV ADR (ASML) is $1054.12. The 52-week low price of ASML Holding NV ADR (ASML) is $560.39.
The price-to-earnings (P/E) ratio of ASML Holding NV ADR (ASML) is 46.94
The price-to-book (P/B) ratio of ASML Holding NV ADR (ASML) is 26.27
The dividend yield of ASML Holding NV ADR (ASML) is 0.73%
The market capitalization of ASML Holding NV ADR (ASML) is $374.40B
The stock symbol (or ticker) of ASML Holding NV ADR is ASML
 Link copied


