

Invest in 5,000+ US Stocks and ETFs
* Offering through VF Securities, Inc. (member FINRA/SIPC)
 Skip to content
BioNTech SE, a biotechnology company, develops and commercializes immunotherapies for cancer and other infectious diseases. The company is developing FixVac product candidates, including BNT111, which is in Phase II clinical trial for advance melanoma; BNT112 that is in Phase I/IIa clinical trial for prostate cancer; BNT113, which is in Phase II clinical trial to treat HPV 16+ head and neck cancers; BNT114 to treat triple negative breast cancer; BNT115, which is in Phase I clinical trial in ovarian cancer; and BNT116, which is in Phase I clinical trial for non-small cell lung cancer. It develops BNT122, which is in Phase II clinical trial for first-line melanoma and in Phase I clinical trial to treat multiple solid tumors; BNT131 that is in Phase I clinical trial for multiple solid tumors; BNT141 and BNT142 that are in Phase I clinical trial to treat multiple solid tumors; BNT151, BNT152, and BNT153 to treat solid tumors; BNT211 to treat multiple solid tumors, and BNT221 for pancreatic and other cancers; BNT311 which are in Phase II clinical trial to treat metastatic non-small cell lung cancer and Phase I/II clinical trial to treat multiple solid tumors; and BNT312, which is in Phase 2 clinical trial to treat multiple solid tumors, as well as ONC-392, which is in Phase III clinical trial to treat ovarian cancer and Phase I/II clinical trial to treat multiple solid tumors. It develops BNT321, an IgG1 monoclonal antibody in Phase I clinical trial for pancreatic cancer; BNT411, a small molecule immunomodulator product candidate in Phase I clinical trial for solid tumors; BNT322, which is in Phase I/Ib clinical trial for multiple solid tumors; and prophylactic vaccine for shingles, malaria, tuberculosis, HSV-2, and other infectious diseases. It has collaborations with Genentech, Inc.; Sanofi S.A.; Genmab A/S; Pfizer Inc.; Shanghai Fosun Pharmaceutical (Group) Co., Ltd; and Ryvu Therapeutics S.A. BioNTech SE was incorporated in 2008 and is based in Mainz, Germany. more
| Time Frame | BNTX | Sector | S&P500; |
|---|---|---|---|
| 1-Week Return | -3.26% | -0.25% | 0.25% |
| 1-Month Return | -9.65% | -2.9% | 0.89% |
| 3-Month Return | -16.08% | 0.87% | 8.31% |
| 6-Month Return | -21.57% | 9.38% | 18.76% |
| 1-Year Return | -31.13% | 7.5% | 27.47% |
| 3-Year Return | -27.45% | 25.66% | 30.79% |
| 5-Year Return | 519.12% | 70.29% | 93.94% |
| Dec '19 | Dec '20 | Dec '21 | Dec '22 | Dec '23 | 5YR TREND | |
|---|---|---|---|---|---|---|
| Total Revenue | 108.59M | 482.32M | 18.98B | 17.31B | 3.82B | [{"date":"2019-12-31","value":0.57,"profit":true},{"date":"2020-12-31","value":2.54,"profit":true},{"date":"2021-12-31","value":100,"profit":true},{"date":"2022-12-31","value":91.22,"profit":true},{"date":"2023-12-31","value":20.12,"profit":true}] |
| Cost of Revenue | 243.83M | 704.36M | 3.86B | 4.53B | 599.80M | [{"date":"2019-12-31","value":5.38,"profit":true},{"date":"2020-12-31","value":15.54,"profit":true},{"date":"2021-12-31","value":85.19,"profit":true},{"date":"2022-12-31","value":100,"profit":true},{"date":"2023-12-31","value":13.23,"profit":true}] |
| Gross Profit | (135.24M) | (222.04M) | 15.12B | 12.78B | 3.22B | [{"date":"2019-12-31","value":-0.89,"profit":false},{"date":"2020-12-31","value":-1.47,"profit":false},{"date":"2021-12-31","value":100,"profit":true},{"date":"2022-12-31","value":84.54,"profit":true},{"date":"2023-12-31","value":21.3,"profit":true}] |
| Gross Margin | (124.54%) | (46.03%) | 79.66% | 73.82% | 84.29% | [{"date":"2019-12-31","value":-147.75,"profit":false},{"date":"2020-12-31","value":-54.61,"profit":false},{"date":"2021-12-31","value":94.5,"profit":true},{"date":"2022-12-31","value":87.57,"profit":true},{"date":"2023-12-31","value":100,"profit":true}] |
| Operating Expenses | 46.28M | (139.62M) | 200.10M | 135.90M | 2.31B | [{"date":"2019-12-31","value":2,"profit":true},{"date":"2020-12-31","value":-6.03,"profit":false},{"date":"2021-12-31","value":8.64,"profit":true},{"date":"2022-12-31","value":5.87,"profit":true},{"date":"2023-12-31","value":100,"profit":true}] |
| Operating Income | (181.52M) | (82.42M) | 15.28B | 12.64B | 690.40M | [{"date":"2019-12-31","value":-1.19,"profit":false},{"date":"2020-12-31","value":-0.54,"profit":false},{"date":"2021-12-31","value":100,"profit":true},{"date":"2022-12-31","value":82.72,"profit":true},{"date":"2023-12-31","value":4.52,"profit":true}] |
| Total Non-Operating Income/Expense | 1.81M | (66.87M) | (263.20M) | 622.80M | 281.90M | [{"date":"2019-12-31","value":0.29,"profit":true},{"date":"2020-12-31","value":-10.74,"profit":false},{"date":"2021-12-31","value":-42.26,"profit":false},{"date":"2022-12-31","value":100,"profit":true},{"date":"2023-12-31","value":45.26,"profit":true}] |
| Pre-Tax Income | (179.44M) | (145.80M) | 15.05B | 12.95B | 1.19B | [{"date":"2019-12-31","value":-1.19,"profit":false},{"date":"2020-12-31","value":-0.97,"profit":false},{"date":"2021-12-31","value":100,"profit":true},{"date":"2022-12-31","value":86.09,"profit":true},{"date":"2023-12-31","value":7.88,"profit":true}] |
| Income Taxes | (268.00K) | (161.00M) | 4.75B | 3.52B | 255.80M | [{"date":"2019-12-31","value":-0.01,"profit":false},{"date":"2020-12-31","value":-3.39,"profit":false},{"date":"2021-12-31","value":100,"profit":true},{"date":"2022-12-31","value":74.04,"profit":true},{"date":"2023-12-31","value":5.38,"profit":true}] |
| Income After Taxes | (179.17M) | 15.20M | 10.29B | 9.43B | 930.30M | [{"date":"2019-12-31","value":-1.74,"profit":false},{"date":"2020-12-31","value":0.15,"profit":true},{"date":"2021-12-31","value":100,"profit":true},{"date":"2022-12-31","value":91.66,"profit":true},{"date":"2023-12-31","value":9.04,"profit":true}] |
| Income From Continuous Operations | (179.17M) | 15.20M | 10.29B | 9.43B | 930.30M | [{"date":"2019-12-31","value":-1.74,"profit":false},{"date":"2020-12-31","value":0.15,"profit":true},{"date":"2021-12-31","value":100,"profit":true},{"date":"2022-12-31","value":91.66,"profit":true},{"date":"2023-12-31","value":9.04,"profit":true}] |
| Income From Discontinued Operations | - | - | - | - | - | [{"date":"2019-12-31","value":"-","profit":true},{"date":"2020-12-31","value":"-","profit":true},{"date":"2021-12-31","value":"-","profit":true},{"date":"2022-12-31","value":"-","profit":true},{"date":"2023-12-31","value":"-","profit":true}] |
| Net Income | (179.17M) | 15.20M | 10.29B | 9.43B | 930.30M | [{"date":"2019-12-31","value":-1.74,"profit":false},{"date":"2020-12-31","value":0.15,"profit":true},{"date":"2021-12-31","value":100,"profit":true},{"date":"2022-12-31","value":91.66,"profit":true},{"date":"2023-12-31","value":9.04,"profit":true}] |
| EPS (Diluted) | (0.39) | 0.07 | 39.69 | 36.93 | 3.89 | [{"date":"2019-12-31","value":-0.98,"profit":false},{"date":"2020-12-31","value":0.18,"profit":true},{"date":"2021-12-31","value":100,"profit":true},{"date":"2022-12-31","value":93.05,"profit":true},{"date":"2023-12-31","value":9.8,"profit":true}] |
These ratios help you determine the liquidity of the company. Higher is better.
| BNTX | |
|---|---|
| Cash Ratio | 7.99 |
| Current Ratio | 9.43 |
| Quick Ratio | 9.26 |
These ratios help you understand the company's efficiency in using its assets to generate returns. Higher is better. For ROE, average long term is around 14%, less than 10% is poor.
| BNTX | |
|---|---|
| ROA (LTM) | 2.62% |
| ROE (LTM) | 4.62% |
These ratios help you understand the company's liabilities, gauging the riskiness of the investment.
| BNTX | |
|---|---|
| Debt Ratio Lower is generally better. Negative is bad. | 0.12 |
| Common Equity/Total Assets Higher is better. Lower can suggest investment is riskier. | 0.88 |
| Debt/Equity The higher the number, the more leverage the business employs, the riskier the investment typically is. | 1.14 |
These ratios help you understand the company's valuation. Lower may indicate cheaper stocks.
| BNTX | |
|---|---|
| Trailing PE | 21.36 |
| Forward PE | 7.04 |
| P/S (TTM) | 5.52 |
| P/B | 0.97 |
| Price/FCF | 32 |
| EV/R | 0.95 |
| EV/Ebitda | 3.33 |
| PEG | NM |

The 2024 presidential election is shaping up to be just as exciting and contentious the 2020 contest. That’s because it looks to be a rematch between President Biden and former President Trump. There’s a wildcard thrown in this time with Robert Kennedy Jr. running an independent campaign that could pull voters from both sides. The stock market went on a rollercoaster ride four years ago. A decade-long bull market was brought up short by the pandemic. The S&P 500 lost one-third of its value in a matter of weeks only to make a U-turn and soar higher once more. It wasn’t uncommon to see stocks soar by 1,000% or more. These are the seven top 2020 stocks that didn’t end up crashing and becoming penny stocks . Can they repeat their prized performance from four years ago? Let’s find out! Novavax (NVAX) Source: pixinoo / Shutterstock.com The pandemic, of course, was the defining moment of 2020. Not only for the devastation it caused in our lives but also for the opportunity it created for companies to rise to the challenge.
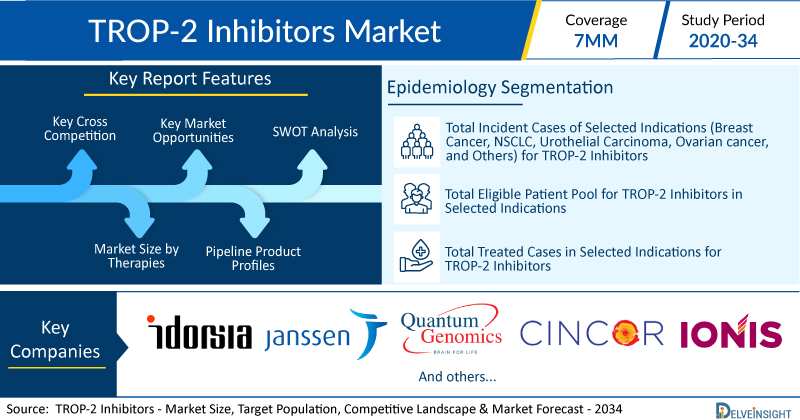
New York, USA, April 09, 2024 (GLOBE NEWSWIRE) — TROP-2 Inhibitors Market to Boost by 2034, Predicts DelveInsight | Key Companies to Look Out – Daiichi Sankyo, AstraZeneca, Kelun Biotech, Merck, DualityBio, BioNTech, BiOneCure Therapeutics According to DelveInsight’s analysis, the growth of the TROP-2 Inhibitors market is expected to be mainly driven by increasing incidence, […]

Biontech Se Sponsored Adr (BNTX) has released an update. BioNTech SE announces its virtual Annual General Meeting (AGM) for shareholders on May 17,…

Biontech Se Sponsored Adr (BNTX) has released an update. BioNTech’s latest three-year follow-up data on its individualized mRNA cancer vaccine, aut…

Three-year follow-up data of an investigator-initiated Phase 1 trial of the individualized mRNA cancer vaccine candidate autogene cevumeran (BNT122, RO7198457) continue to show polyspecific T cell …

Exclusive: Multi-dose vials could push up charge per patient, while experts warn high cost could widen inequalities Cheaper private Covid jabs could end up being just as expensive as their pricier alternative because the vaccine must be given in groups of five, experts have warned. Boots and pharmacies that partner with the company Pharmadoctor are offering Pfizer/BioNTech jabs to those not eligible for a free vaccination through the NHS, with the former charging almost £100 a shot. The latter is also offering the latest Novavax jab, a protein-based vaccine, at a cost of about £50. Continue reading…

Best bargain stocks to buy is a simple but tricky concept. Whenever shares trade lower than an established multiple, whether that by earnings, sales, book or some other metric, there might be a reason for it. In many cases, it’s not a good one. Let’s face reality here. In the age of the internet, it’s difficult for a well-known publicly traded enterprise to be woefully undervalued. That’s because information is readily available. If the market genuinely believed there was value to be extracted, the shares in question would have likely jumped higher by now. Still, there are thousands upon thousands of opportunities. It’s impossible to pay attention to them all. In that regard, Wall Street can certainly miss a few. With that, below are intriguing ideas for best bargain stocks to buy. BioNTech (BNTX) Source: Palatinate Stock / Shutterstock.com Operating under the biotechnology sector, BioNTech (NASDAQ: BNTX ) develops and commercializes immunotherapies for cancer and other infectious diseases.

As we step into March 2024, the spotlight is turning towards the biotech sector, with investors searching for biotech stocks to buy. Biotech stocks are ready to soar after a period of under-performance relative to the broader market. With advancements in gene editing, personalized medicine and novel therapeutics, the sector is on the cusp of delivering transformative healthcare solutions. The global biotechnology market is set for remarkable growth . It is forecast to soar from $1 trillion in 2022 to an impressive $3.6 trillion by 2032. This translates to a CAGR of 14%. Demand for innovative treatments and vaccines continues to surge, potentially unlocking exponential growth for well-positioned biotech companies. Given the positive trends, investors can benefit from the rise in biotech stocks. I have identified three biotech stocks to buy that are well-positioned for growth in the next bull run. Vertex Pharmaceuticals (VRTX) Source: Shutterstock Vertex Pharmaceuticals (NASDAQ: VRTX ) is increasingly capturing the attention of growth-focused investors.
BioNTech SE (BNTX) share price today is $87.01
Yes, Indians can buy shares of BioNTech SE (BNTX) on Vested. To buy
Yes, you can purchase fractional shares of BioNTech SE (BNTX) via the Vested app. You can start investing in BioNTech SE (BNTX) with a minimum investment of $1.
You can invest in shares of BioNTech SE (BNTX) via Vested in three simple steps:
The 52-week high price of BioNTech SE (BNTX) is $131.52. The 52-week low price of BioNTech SE (BNTX) is $85.21.
The price-to-earnings (P/E) ratio of BioNTech SE (BNTX) is 20.52
The price-to-book (P/B) ratio of BioNTech SE (BNTX) is 0.97
The dividend yield of BioNTech SE (BNTX) is 0.00%
The market capitalization of BioNTech SE (BNTX) is $20.68B
The stock symbol (or ticker) of BioNTech SE is BNTX
 Link copied


