

Invest in 5,000+ US Stocks and ETFs
* Offering through VF Securities, Inc. (member FINRA/SIPC)
 Skip to content
Etsy, Inc., together with its subsidiaries, operates two-sided online marketplaces that connect buyers and sellers in the United States, the United Kingdom, Germany, Canada, Australia, and France. Its primary marketplace is Etsy.com that connects artisans and entrepreneurs with various consumers. The company also offers Reverb, a musical instrument marketplace; Depop, a fashion resale marketplace; and Elo7, a Brazil-based marketplace for handmade and unique items. In addition, it offers various seller services, including Etsy Payments, a payment processing service; Etsy Ads, an advertising platform; and Shipping Labels, which allows sellers in the United States, Canada, the United Kingdom, Australia, and India to purchase discounted shipping labels. Further, the company provides the Etsy Purchase Protection program that is designed to help buyers; the Etsy Share and Save program for sellers to save on Etsy fees for sales that drive to their Etsy shop from their own channels. Additionally, it offers educational resources comprising blog posts, video tutorials, Etsy Seller Handbook, Etsy.com online forums, and insights; Etsy Teams, a platform to build personal relationships with other Etsy sellers; and a Star Seller program. The company was formerly known as Indieco, Inc changed its name to Etsy, Inc. in June 2006. Etsy, Inc. was founded in 2005 and is headquartered in Brooklyn, New York. more
| Time Frame | ETSY | Sector | S&P500; |
|---|---|---|---|
| 1-Week Return | -0.43% | - | - |
| 1-Month Return | -0.12% | -5.99% | -3.5% |
| 3-Month Return | -5.52% | -2.72% | 3.86% |
| 6-Month Return | 2.05% | 10.61% | 17.98% |
| 1-Year Return | -34.79% | 15.56% | 22.44% |
| 3-Year Return | -68.69% | -2.24% | 25.9% |
| 5-Year Return | 5.12% | 49.7% | 86.97% |
| 10-Year Return | 122.53% | 198.73% | 221.66% |
| Dec '19 | Dec '20 | Dec '21 | Dec '22 | Dec '23 | 5YR TREND | |
|---|---|---|---|---|---|---|
| Total Revenue | 818.38M | 1.73B | 2.33B | 2.57B | 2.75B | [{"date":"2019-12-31","value":29.78,"profit":true},{"date":"2020-12-31","value":62.79,"profit":true},{"date":"2021-12-31","value":84.75,"profit":true},{"date":"2022-12-31","value":93.37,"profit":true},{"date":"2023-12-31","value":100,"profit":true}] |
| Cost of Revenue | 271.04M | 464.75M | 654.51M | 744.59M | 828.67M | [{"date":"2019-12-31","value":32.71,"profit":true},{"date":"2020-12-31","value":56.08,"profit":true},{"date":"2021-12-31","value":78.98,"profit":true},{"date":"2022-12-31","value":89.85,"profit":true},{"date":"2023-12-31","value":100,"profit":true}] |
| Gross Profit | 547.34M | 1.26B | 1.67B | 1.82B | 1.92B | [{"date":"2019-12-31","value":28.51,"profit":true},{"date":"2020-12-31","value":65.68,"profit":true},{"date":"2021-12-31","value":87.23,"profit":true},{"date":"2022-12-31","value":94.89,"profit":true},{"date":"2023-12-31","value":100,"profit":true}] |
| Gross Margin | 66.88% | 73.07% | 71.90% | 70.98% | 69.85% | [{"date":"2019-12-31","value":91.53,"profit":true},{"date":"2020-12-31","value":100,"profit":true},{"date":"2021-12-31","value":98.4,"profit":true},{"date":"2022-12-31","value":97.15,"profit":true},{"date":"2023-12-31","value":95.59,"profit":true}] |
| Operating Expenses | 458.58M | 836.87M | 1.21B | 2.48B | 1.57B | [{"date":"2019-12-31","value":18.49,"profit":true},{"date":"2020-12-31","value":33.74,"profit":true},{"date":"2021-12-31","value":48.74,"profit":true},{"date":"2022-12-31","value":100,"profit":true},{"date":"2023-12-31","value":63.38,"profit":true}] |
| Operating Income | 88.76M | 424.01M | 465.73M | (658.56M) | 279.84M | [{"date":"2019-12-31","value":19.06,"profit":true},{"date":"2020-12-31","value":91.04,"profit":true},{"date":"2021-12-31","value":100,"profit":true},{"date":"2022-12-31","value":-141.4,"profit":false},{"date":"2023-12-31","value":60.09,"profit":true}] |
| Total Non-Operating Income/Expense | (19.24M) | (93.22M) | (1.83M) | (1.05B) | (55.11M) | [{"date":"2019-12-31","value":-1923600000,"profit":false},{"date":"2020-12-31","value":-9322300000,"profit":false},{"date":"2021-12-31","value":-182600000,"profit":false},{"date":"2022-12-31","value":-105165200000,"profit":false},{"date":"2023-12-31","value":-5511200000,"profit":false}] |
| Pre-Tax Income | 80.65M | 365.71M | 471.65M | (661.98M) | 292.82M | [{"date":"2019-12-31","value":17.1,"profit":true},{"date":"2020-12-31","value":77.54,"profit":true},{"date":"2021-12-31","value":100,"profit":true},{"date":"2022-12-31","value":-140.35,"profit":false},{"date":"2023-12-31","value":62.08,"profit":true}] |
| Income Taxes | (15.25M) | 16.46M | (21.85M) | 32.31M | (14.75M) | [{"date":"2019-12-31","value":-47.19,"profit":false},{"date":"2020-12-31","value":50.95,"profit":true},{"date":"2021-12-31","value":-67.64,"profit":false},{"date":"2022-12-31","value":100,"profit":true},{"date":"2023-12-31","value":-45.65,"profit":false}] |
| Income After Taxes | 95.89M | 349.25M | 493.51M | (694.29M) | 307.57M | [{"date":"2019-12-31","value":19.43,"profit":true},{"date":"2020-12-31","value":70.77,"profit":true},{"date":"2021-12-31","value":100,"profit":true},{"date":"2022-12-31","value":-140.68,"profit":false},{"date":"2023-12-31","value":62.32,"profit":true}] |
| Income From Continuous Operations | 95.89M | 349.25M | 493.51M | (694.29M) | 307.57M | [{"date":"2019-12-31","value":19.43,"profit":true},{"date":"2020-12-31","value":70.77,"profit":true},{"date":"2021-12-31","value":100,"profit":true},{"date":"2022-12-31","value":-140.68,"profit":false},{"date":"2023-12-31","value":62.32,"profit":true}] |
| Income From Discontinued Operations | - | - | - | - | - | [{"date":"2019-12-31","value":"-","profit":true},{"date":"2020-12-31","value":"-","profit":true},{"date":"2021-12-31","value":"-","profit":true},{"date":"2022-12-31","value":"-","profit":true},{"date":"2023-12-31","value":"-","profit":true}] |
| Net Income | 95.89M | 349.25M | 493.51M | (694.29M) | 307.57M | [{"date":"2019-12-31","value":19.43,"profit":true},{"date":"2020-12-31","value":70.77,"profit":true},{"date":"2021-12-31","value":100,"profit":true},{"date":"2022-12-31","value":-140.68,"profit":false},{"date":"2023-12-31","value":62.32,"profit":true}] |
| EPS (Diluted) | 0.76 | 2.69 | 3.41 | (5.74) | 2.25 | [{"date":"2019-12-31","value":22.29,"profit":true},{"date":"2020-12-31","value":78.89,"profit":true},{"date":"2021-12-31","value":100,"profit":true},{"date":"2022-12-31","value":-168.33,"profit":false},{"date":"2023-12-31","value":65.98,"profit":true}] |
These ratios help you determine the liquidity of the company. Higher is better.
| ETSY | |
|---|---|
| Cash Ratio | 1.62 |
| Current Ratio | 2.21 |
These ratios help you understand the company's efficiency in using its assets to generate returns. Higher is better. For ROE, average long term is around 14%, less than 10% is poor.
| ETSY | |
|---|---|
| ROA (LTM) | 8.83% |
| ROE (LTM) | -1224.50% |
These ratios help you understand the company's liabilities, gauging the riskiness of the investment.
| ETSY | |
|---|---|
| Debt Ratio Lower is generally better. Negative is bad. | 1.20 |
| Common Equity/Total Assets Higher is better. Lower can suggest investment is riskier. | -0.20 |
| Debt/Equity The higher the number, the more leverage the business employs, the riskier the investment typically is. | -4.94 |
These ratios help you understand the company's valuation. Lower may indicate cheaper stocks.
| ETSY | |
|---|---|
| Trailing PE | 30.06 |
| Forward PE | 18.62 |
| P/S (TTM) | 2.89 |
| P/B | 21.42 |
| Price/FCF | 28 |
| EV/R | 3.34 |
| EV/Ebitda | 23.06 |
| PEG | 0.19 |

Out of popular e-commerce stocks, Etsy (NASDAQ:ETSY) and eBay (NASDAQ:EBAY), one of them is a Buy, according to Morgan Stanley analyst Nathan Feath…
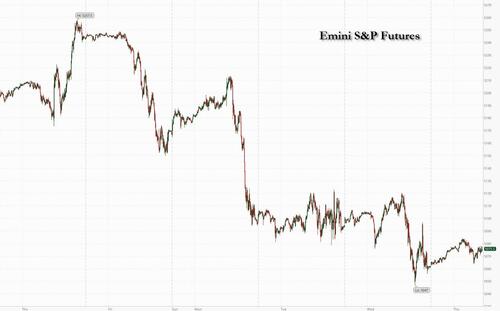
Futures Rise After 4 Straight Days Of Losses US equity futures are higher after four consecutive days of selling, although that is the same pattern we have seen all week as futures initially rise only to dump later in the day. As of 7:40am, S&P futures are up 0.3% while tech stocks were set to outperform, pushing the Nasdaq 0.4% higher after TSMC delivered a better-than-projected revenue outlook. An index of global chip stocks and AI poster child Nvidia fell into a technical correction amid the recent selloff, with Evercore ISI analyst Julian Emanuel thinking this is only the start , with the downdraft in stocks only starting and set to continue through the rest of 2024. The dollar steadied, while US Treasuries pared an earlier gain to trade flat. In Europe, major markets are higher with Spain/France leading and Germany lagging. Commodities are mixed: oil is falling further; precious and base metals are higher. Reports from Netflix and L’Oreal are due after the close of their respective markets.

Morgan Stanley says investors should buy eBay and short Etsy in a call on the $1.1 trillion U.S. ecommerce market.

Etsy, Inc. (Nasdaq: ETSY), which operates two-sided online marketplaces that connect millions of passionate and creative buyers and sellers around the world, plans to release its first quarter 2024 financial results after market close on Wednesday, May 1, 2024. The press release can be accessed on the Etsy Investor Relations website ( investors.etsy.com ). Etsy will also host a video webcast conference call to discuss those results at 5:00 p.m. Eastern Time on the same day, which will be live-streamed via the Company''s Investor Relations website ( investors.etsy.com ) under the events section. Publishing research analysts will be provided an opportunity to ask company management live questions on the call. A copy of the earnings call presentation will also be posted to our website. A replay of the video webcast will be available through the same link following the conference call starting at 8:00 p.m. Eastern Time that evening, for at least three months thereafter. About Etsy Etsy,

Etsy Inc (ETSY) share price today is $66.76
Yes, Indians can buy shares of Etsy Inc (ETSY) on Vested. To buy Etsy Inc from India, you can open a US Brokerage account on Vested today by clicking on Sign Up or Invest in ETSY stock at the top of this page. The account opening process is completely digital and secure, and takes a few minutes to complete.
Yes, you can purchase fractional shares of Etsy Inc (ETSY) via the Vested app. You can start investing in Etsy Inc (ETSY) with a minimum investment of $1.
You can invest in shares of Etsy Inc (ETSY) via Vested in three simple steps:
The 52-week high price of Etsy Inc (ETSY) is $103.25. The 52-week low price of Etsy Inc (ETSY) is $58.2.
The price-to-earnings (P/E) ratio of Etsy Inc (ETSY) is 30.48
The price-to-book (P/B) ratio of Etsy Inc (ETSY) is 21.42
The dividend yield of Etsy Inc (ETSY) is 0.00%
The market capitalization of Etsy Inc (ETSY) is $7.91B
The stock symbol (or ticker) of Etsy Inc is ETSY
 Link copied


