

Invest in 5,000+ US Stocks and ETFs
* Offering through VF Securities, Inc. (member FINRA/SIPC)
 Skip to content
Alphabet Inc. offers various products and platforms in the United States, Europe, the Middle East, Africa, the Asia-Pacific, Canada, and Latin America. It operates through Google Services, Google Cloud, and Other Bets segments. The Google Services segment provides products and services, including ads, Android, Chrome, devices, Gmail, Google Drive, Google Maps, Google Photos, Google Play, Search, and YouTube. It is also involved in the sale of apps and in-app purchases and digital content in the Google Play and YouTube; and devices, as well as in the provision of YouTube consumer subscription services. The Google Cloud segment offers infrastructure, cybersecurity, databases, analytics, AI, and other services; Google Workspace that include cloud-based communication and collaboration tools for enterprises, such as Gmail, Docs, Drive, Calendar, and Meet; and other services for enterprise customers. The Other Bets segment sells healthcare-related and internet services. The company was incorporated in 1998 and is headquartered in Mountain View, California. more
| Time Frame | GOOGL | Sector | S&P500; |
|---|---|---|---|
| 1-Week Return | -2.31% | - | - |
| 1-Month Return | 4.8% | -1.49% | -3.5% |
| 3-Month Return | 5.27% | 6.49% | 3.86% |
| 6-Month Return | 11.86% | 18.98% | 17.98% |
| 1-Year Return | 47.91% | 37.94% | 22.44% |
| 3-Year Return | 34.59% | 6.86% | 25.9% |
| 5-Year Return | 145.8% | 68.25% | 86.97% |
| 10-Year Return | 471.37% | 67.55% | 221.66% |
| Dec '19 | Dec '20 | Dec '21 | Dec '22 | Dec '23 | 5YR TREND | |
|---|---|---|---|---|---|---|
| Total Revenue | 161.86B | 182.53B | 257.64B | 282.84B | 307.39B | [{"date":"2019-12-31","value":52.65,"profit":true},{"date":"2020-12-31","value":59.38,"profit":true},{"date":"2021-12-31","value":83.81,"profit":true},{"date":"2022-12-31","value":92.01,"profit":true},{"date":"2023-12-31","value":100,"profit":true}] |
| Cost of Revenue | 71.90B | 84.73B | 110.94B | 126.20B | 133.33B | [{"date":"2019-12-31","value":53.92,"profit":true},{"date":"2020-12-31","value":63.55,"profit":true},{"date":"2021-12-31","value":83.21,"profit":true},{"date":"2022-12-31","value":94.65,"profit":true},{"date":"2023-12-31","value":100,"profit":true}] |
| Gross Profit | 89.96B | 97.80B | 146.70B | 156.63B | 174.06B | [{"date":"2019-12-31","value":51.68,"profit":true},{"date":"2020-12-31","value":56.18,"profit":true},{"date":"2021-12-31","value":84.28,"profit":true},{"date":"2022-12-31","value":89.99,"profit":true},{"date":"2023-12-31","value":100,"profit":true}] |
| Gross Margin | 55.58% | 53.58% | 56.94% | 55.38% | 56.63% | [{"date":"2019-12-31","value":97.61,"profit":true},{"date":"2020-12-31","value":94.1,"profit":true},{"date":"2021-12-31","value":100,"profit":true},{"date":"2022-12-31","value":97.26,"profit":true},{"date":"2023-12-31","value":99.45,"profit":true}] |
| Operating Expenses | 54.03B | 56.57B | 67.98B | 81.79B | 89.77B | [{"date":"2019-12-31","value":60.19,"profit":true},{"date":"2020-12-31","value":63.02,"profit":true},{"date":"2021-12-31","value":75.73,"profit":true},{"date":"2022-12-31","value":91.11,"profit":true},{"date":"2023-12-31","value":100,"profit":true}] |
| Operating Income | 34.23B | 41.22B | 78.71B | 74.84B | 84.29B | [{"date":"2019-12-31","value":40.61,"profit":true},{"date":"2020-12-31","value":48.91,"profit":true},{"date":"2021-12-31","value":93.38,"profit":true},{"date":"2022-12-31","value":88.79,"profit":true},{"date":"2023-12-31","value":100,"profit":true}] |
| Total Non-Operating Income/Expense | 7.72B | 8.59B | 13.17B | (1.70B) | 952.00M | [{"date":"2019-12-31","value":58.61,"profit":true},{"date":"2020-12-31","value":65.19,"profit":true},{"date":"2021-12-31","value":100,"profit":true},{"date":"2022-12-31","value":-12.88,"profit":false},{"date":"2023-12-31","value":7.23,"profit":true}] |
| Pre-Tax Income | 39.63B | 48.08B | 90.73B | 71.33B | 85.72B | [{"date":"2019-12-31","value":43.67,"profit":true},{"date":"2020-12-31","value":52.99,"profit":true},{"date":"2021-12-31","value":100,"profit":true},{"date":"2022-12-31","value":78.61,"profit":true},{"date":"2023-12-31","value":94.47,"profit":true}] |
| Income Taxes | 5.28B | 7.81B | 14.70B | 11.36B | 11.92B | [{"date":"2019-12-31","value":35.93,"profit":true},{"date":"2020-12-31","value":53.15,"profit":true},{"date":"2021-12-31","value":100,"profit":true},{"date":"2022-12-31","value":77.25,"profit":true},{"date":"2023-12-31","value":81.1,"profit":true}] |
| Income After Taxes | 34.34B | 40.27B | 76.03B | 59.97B | 73.80B | [{"date":"2019-12-31","value":45.17,"profit":true},{"date":"2020-12-31","value":52.96,"profit":true},{"date":"2021-12-31","value":100,"profit":true},{"date":"2022-12-31","value":78.88,"profit":true},{"date":"2023-12-31","value":97.06,"profit":true}] |
| Income From Continuous Operations | 34.34B | 40.27B | 76.03B | 59.97B | 66.73B | [{"date":"2019-12-31","value":45.17,"profit":true},{"date":"2020-12-31","value":52.96,"profit":true},{"date":"2021-12-31","value":100,"profit":true},{"date":"2022-12-31","value":78.88,"profit":true},{"date":"2023-12-31","value":87.77,"profit":true}] |
| Income From Discontinued Operations | - | - | - | - | - | [{"date":"2019-12-31","value":"-","profit":true},{"date":"2020-12-31","value":"-","profit":true},{"date":"2021-12-31","value":"-","profit":true},{"date":"2022-12-31","value":"-","profit":true},{"date":"2023-12-31","value":"-","profit":true}] |
| Net Income | 34.34B | 40.27B | 76.03B | 59.97B | 73.80B | [{"date":"2019-12-31","value":45.17,"profit":true},{"date":"2020-12-31","value":52.96,"profit":true},{"date":"2021-12-31","value":100,"profit":true},{"date":"2022-12-31","value":78.88,"profit":true},{"date":"2023-12-31","value":97.06,"profit":true}] |
| EPS (Diluted) | 2.46 | 2.94 | 5.60 | 4.55 | 5.80 | [{"date":"2019-12-31","value":42.4,"profit":true},{"date":"2020-12-31","value":50.75,"profit":true},{"date":"2021-12-31","value":96.55,"profit":true},{"date":"2022-12-31","value":78.45,"profit":true},{"date":"2023-12-31","value":100,"profit":true}] |
These ratios help you determine the liquidity of the company. Higher is better.
| GOOGL | Peers | |
|---|---|---|
| Cash Ratio | 1.36 | 0.28 |
| Current Ratio | 2.10 | 0.89 |
These ratios help you understand the company's efficiency in using its assets to generate returns. Higher is better. For ROE, average long term is around 14%, less than 10% is poor.
| GOOGL | Peers | |
|---|---|---|
| ROA (LTM) | 14.37% | 3.48% |
| ROE (LTM) | 27.36% | 11.18% |
These ratios help you understand the company's liabilities, gauging the riskiness of the investment.
| GOOGL | Peers | |
|---|---|---|
| Debt Ratio Lower is generally better. Negative is bad. | 0.30 | 0.62 |
| Common Equity/Total Assets Higher is better. Lower can suggest investment is riskier. | 0.70 | 0.38 |
| Debt/Equity The higher the number, the more leverage the business employs, the riskier the investment typically is. | 1.42 | 1.99 |
These ratios help you understand the company's valuation. Lower may indicate cheaper stocks.
| GOOGL | Peers | |
|---|---|---|
| Trailing PE | 26.90 | - |
| Forward PE | 23.20 | - |
| P/S (TTM) | 6.41 | 0.01 |
| P/B | 6.92 | 1.70 |
| Price/FCF | 247 | NM |
| EV/R | 6.14 | 0.01 |
| EV/Ebitda | 19.27 | 0.06 |
| PEG | 0.67 | - |

The US GDP data for first quarter will be released on April 25, followed by Federal Reserve’s preferred inflation gauge PCE index data on April 26
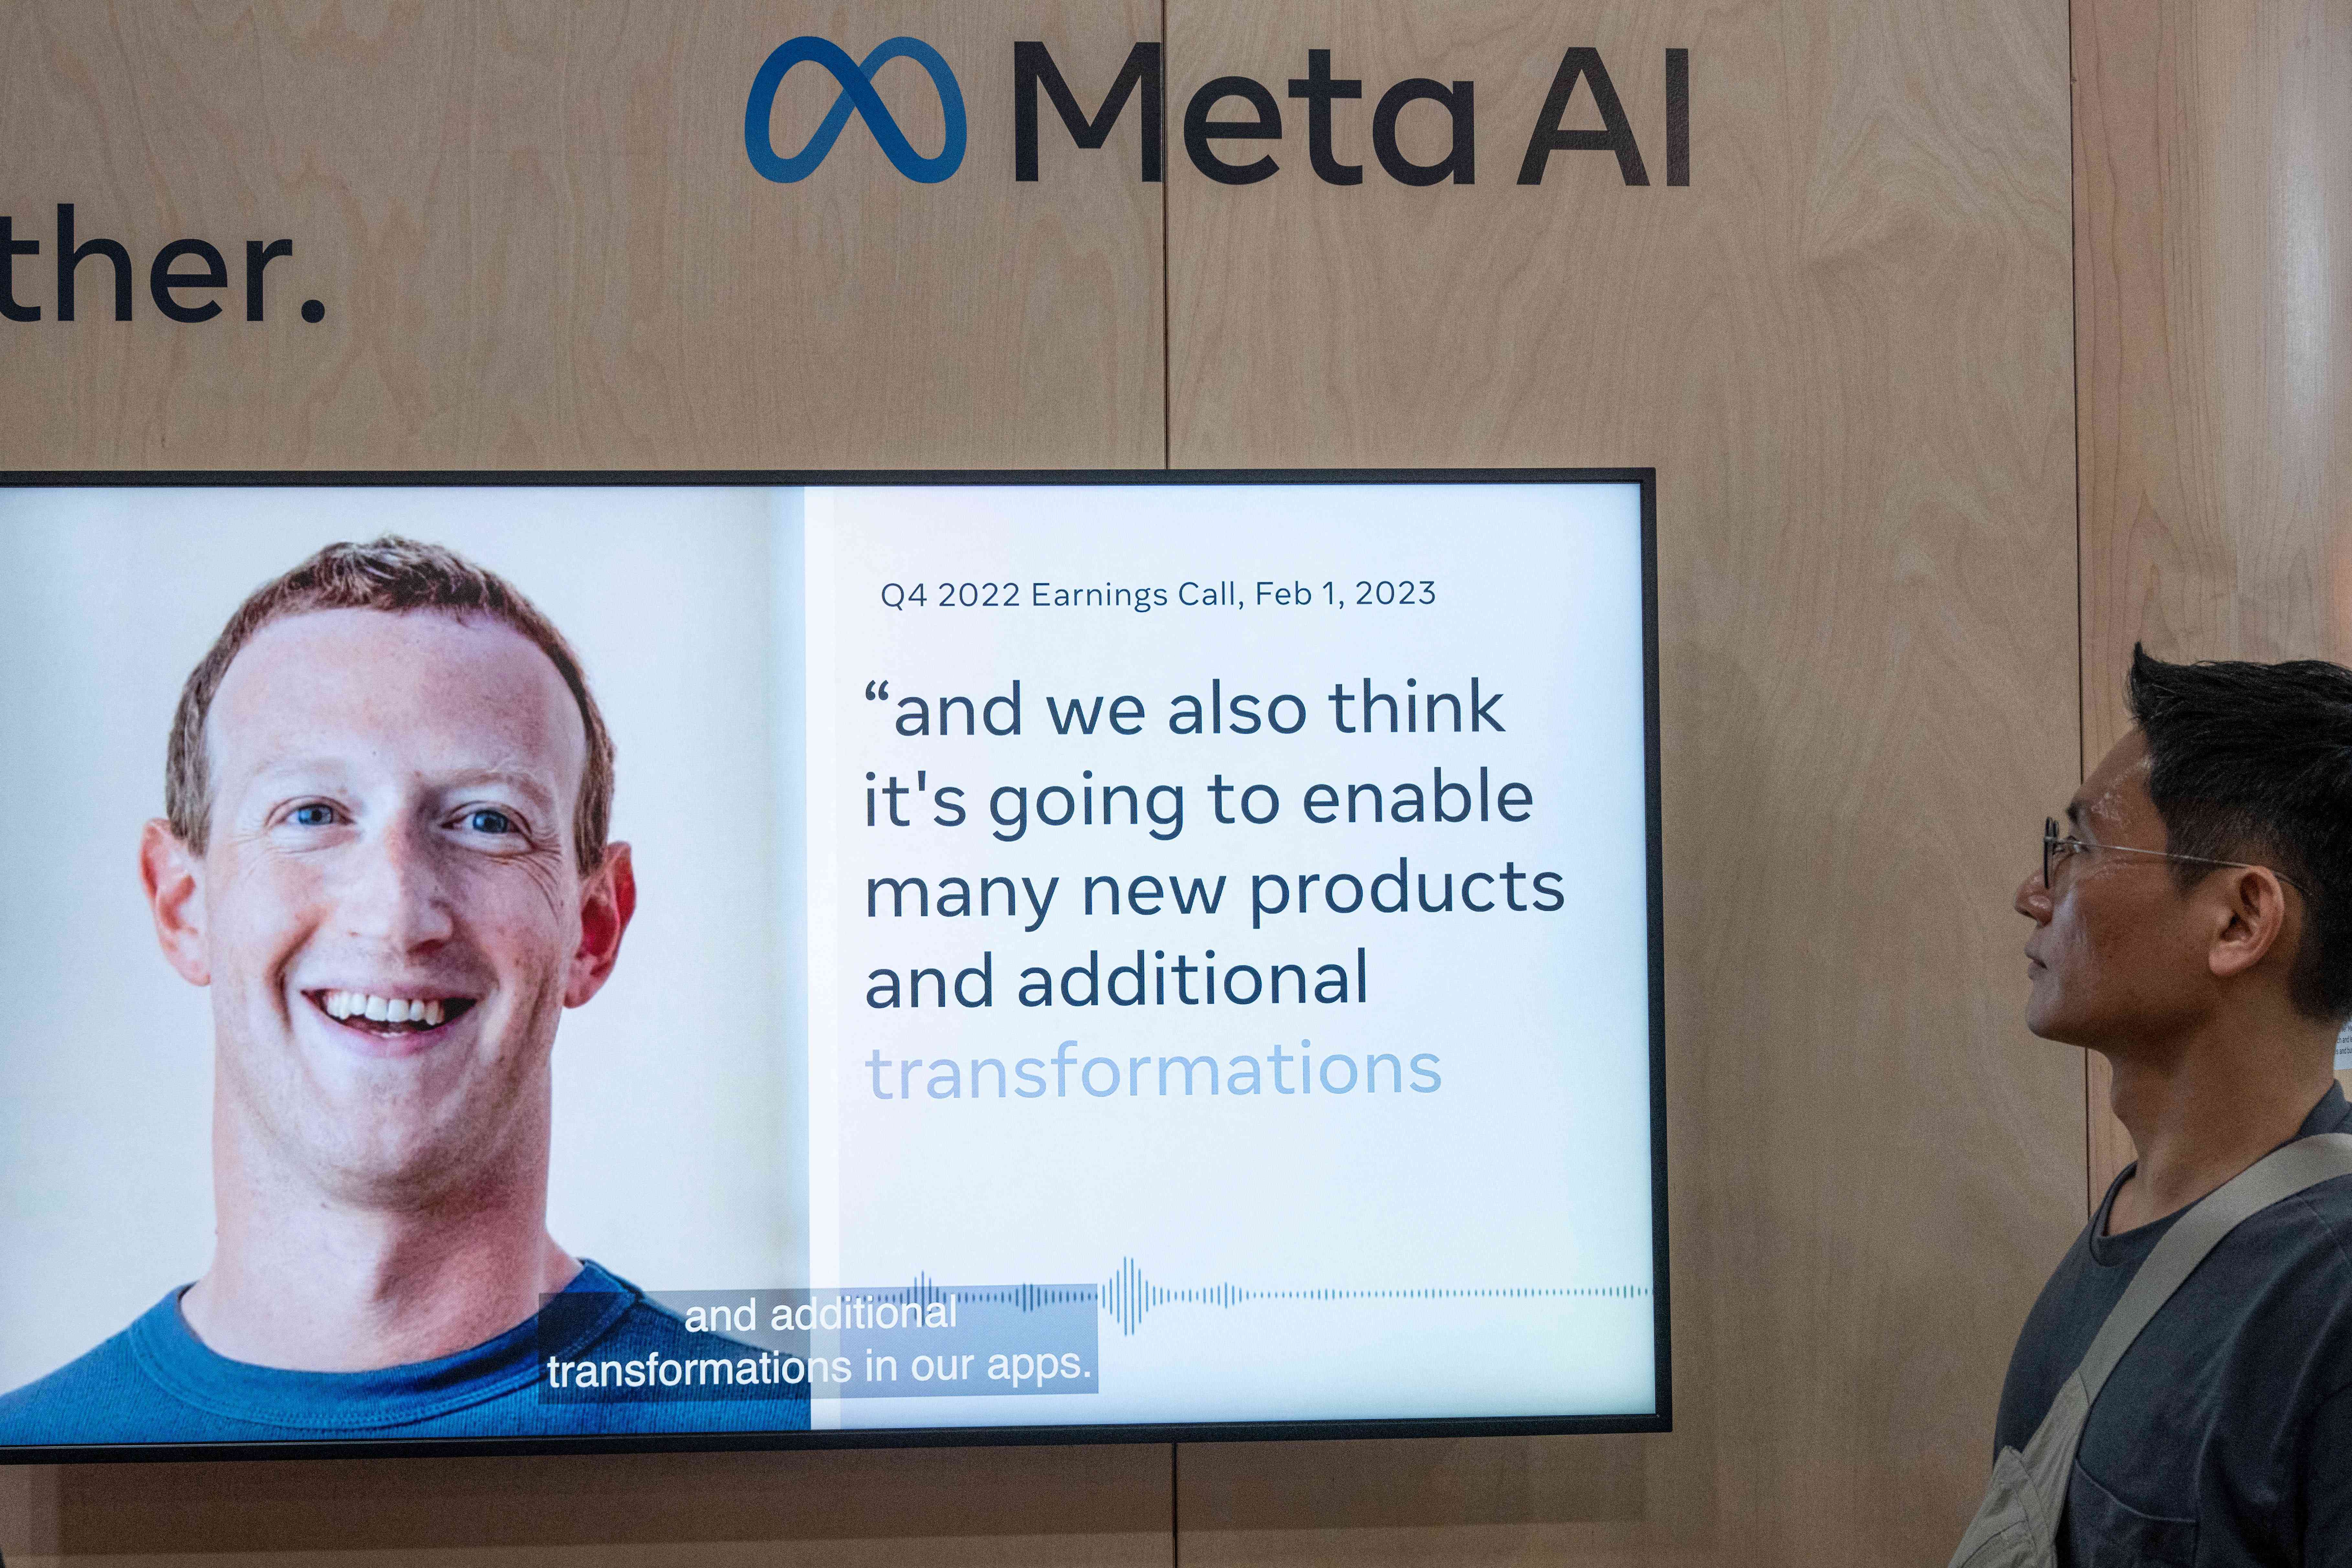
With Meta''s earnings report on Wednesday and Google parent Alphabet and Microsoft set to release theirs on Thursday, analysts expect artificial intelligence (AI) to be a key theme for big tech.
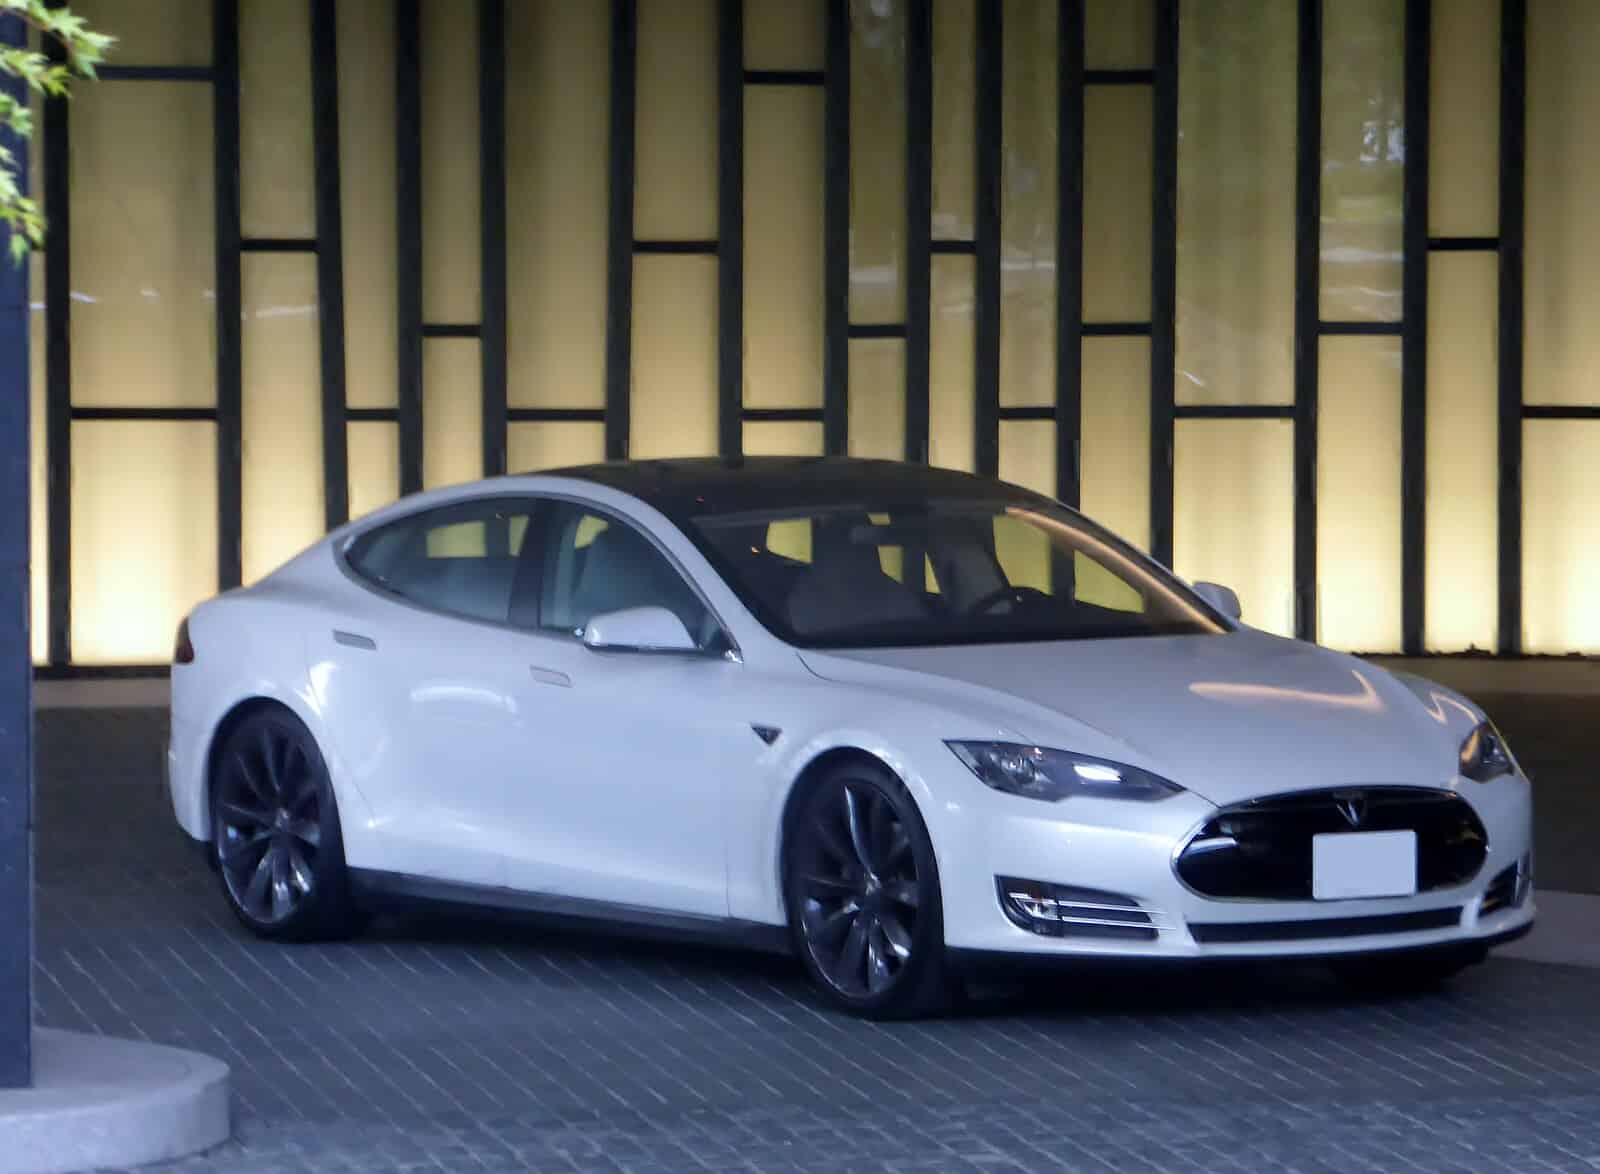
… negative publicity about the software that centers around whether … safe. However, the car company ’s description also says, “ … It faces challenges from software companies which include Alphabet’s Wayo … possible, given that no company has demonstrated that it …

The market''s knee-jerk response the last time around was the wrong call. Investors aren''t apt to make the same mistake again.
Nasdaq index gets creamed as high flyers take it on the chin Feds Financial Stability Report: Persistent inflation/tigher policy biggest risk Bank of Canada''s Macklem: Inflation is continuing to become less broad-based Crude oil futures settle at $82.22. What are the technicals telling traders. ECBs Muller: Sees a few more rate cuts by year end after June IMFs Japan Mission Chief: Weak yens impact on Japans economic growth is net positive BOEs Mann: Central banks will have to use autonomy effectively Baker Hughes oil rig count 511 vs 506 last week European indices close the week with mixed results IMF''s Georgieva: Need to finish the job on inflation ECB Wunsche: I dont have base case, but unlikely we cut only once in 2024 More from BOE Ramsden: We will take into account Forex implications for inflation More Goolsbee:There are some measures in the economy, that historically don''t portend well More Goolsbee: We have done great on the employment mandate but not on inflation Chicago Fed Pres.
Apple (NASDAQ: AAPL ) may be losing momentum among VR stocks, even as tech advancements continue elevating the burgeoning sector into public consciousness. More than half of teens who own the Apple Vision Pro or similar devices rarely use them , which is a death knell for companies like Apple trying to target the next generation of tech consumers. To that end, Apple is strategically pivoting to market the Vision Pro as an ideal business/remote work tool. Priced at $3,500 and on the heels of Zuckerberg’s attempt to do the same, I’m not optimistic. Unfortunately, Apple may be heading for a lost decade (or worse) as it continually fails to innovate tech that excites consumers. Apple’s top sellers are simply iterations of existing products, and their new initiatives (beyond just the Vision Pro) tend to disappoint or die on the vine — Apple Car, anyone? Understandably, Vision Pro’s struggle is spooking investors bullish on VR stocks’ long-term potential. But don’t throw out the baby with the bathwater.
Alphabet Inc Class A (GOOGL) share price today is $154.09
Yes, Indians can buy shares of Alphabet Inc Class A (GOOGL) on Vested. To buy Alphabet Inc Class A from India, you can open a US Brokerage account on Vested today by clicking on Sign Up or Invest in GOOGL stock at the top of this page. The account opening process is completely digital and secure, and takes a few minutes to complete.
Yes, you can purchase fractional shares of Alphabet Inc Class A (GOOGL) via the Vested app. You can start investing in Alphabet Inc Class A (GOOGL) with a minimum investment of $1.
You can invest in shares of Alphabet Inc Class A (GOOGL) via Vested in three simple steps:
The 52-week high price of Alphabet Inc Class A (GOOGL) is $160.22. The 52-week low price of Alphabet Inc Class A (GOOGL) is $102.63.
The price-to-earnings (P/E) ratio of Alphabet Inc Class A (GOOGL) is 26.38
The price-to-book (P/B) ratio of Alphabet Inc Class A (GOOGL) is 6.92
The dividend yield of Alphabet Inc Class A (GOOGL) is 0.00%
The market capitalization of Alphabet Inc Class A (GOOGL) is $1.94T
The stock symbol (or ticker) of Alphabet Inc Class A is GOOGL
 Link copied


