

Invest in 5,000+ US Stocks and ETFs
* Offering through VF Securities, Inc. (member FINRA/SIPC)
 Skip to content
Lemonade, Inc. provides various insurance products through various channels in the United States, Europe, and the United Kingdom. Its insurance products include stolen or damaged property, and personal liability that protects its customers if they are responsible for an accident or damage to another person or their property. The company also offers renters, homeowners, car, pet, and life insurance products, as well as landlord insurance policies. In addition, it operates as an agent for other insurance companies. The company was formerly known as Lemonade Group, Inc. and changed its name to Lemonade, Inc. Lemonade, Inc. was incorporated in 2015 and is headquartered in New York, New York. more
| Time Frame | LMND | Sector | S&P500 |
|---|---|---|---|
| 1-Week Return | 8.97% | 3.23% | -0.81% |
| 1-Month Return | 6.06% | -0.95% | -3.95% |
| 3-Month Return | 1.8% | 7.48% | 3.35% |
| 6-Month Return | 51.04% | 28.83% | 19.7% |
| 1-Year Return | 50.13% | 25.52% | 22.93% |
| 3-Year Return | -81.38% | 22.21% | 25.5% |
| 5-Year Return | -74.8% | 64.94% | 85.41% |
| Dec '19 | Dec '20 | Dec '21 | Dec '22 | Dec '23 | 5YR TREND | |
|---|---|---|---|---|---|---|
| Total Revenue | 67.30M | 94.40M | 128.40M | 256.70M | 360.00M | [{"date":"2019-12-31","value":18.69,"profit":true},{"date":"2020-12-31","value":26.22,"profit":true},{"date":"2021-12-31","value":35.67,"profit":true},{"date":"2022-12-31","value":71.31,"profit":true},{"date":"2023-12-31","value":100,"profit":true}] |
| Cost of Revenue | - | - | - | - | - | [{"date":"2019-12-31","value":"-","profit":true},{"date":"2020-12-31","value":"-","profit":true},{"date":"2021-12-31","value":"-","profit":true},{"date":"2022-12-31","value":"-","profit":true},{"date":"2023-12-31","value":"-","profit":true}] |
| Gross Profit | 67.30M | 94.40M | 128.40M | 256.70M | 360.00M | [{"date":"2019-12-31","value":18.69,"profit":true},{"date":"2020-12-31","value":26.22,"profit":true},{"date":"2021-12-31","value":35.67,"profit":true},{"date":"2022-12-31","value":71.31,"profit":true},{"date":"2023-12-31","value":100,"profit":true}] |
| Gross Margin | 100.00% | 100.00% | 100.00% | 100.00% | 100.00% | [{"date":"2019-12-31","value":100,"profit":true},{"date":"2020-12-31","value":100,"profit":true},{"date":"2021-12-31","value":100,"profit":true},{"date":"2022-12-31","value":100,"profit":true},{"date":"2023-12-31","value":100,"profit":true}] |
| Operating Expenses | (175.20M) | (215.20M) | (362.00M) | 266.00M | 272.00M | [{"date":"2019-12-31","value":-64.41,"profit":false},{"date":"2020-12-31","value":-79.12,"profit":false},{"date":"2021-12-31","value":-133.09,"profit":false},{"date":"2022-12-31","value":97.79,"profit":true},{"date":"2023-12-31","value":100,"profit":true}] |
| Operating Income | (107.90M) | (120.80M) | (233.60M) | (294.80M) | - | [{"date":"2019-12-31","value":-10790000000,"profit":false},{"date":"2020-12-31","value":-12080000000,"profit":false},{"date":"2021-12-31","value":-23360000000,"profit":false},{"date":"2022-12-31","value":-29480000000,"profit":false},{"date":"2023-12-31","value":"-","profit":true}] |
| Total Non-Operating Income/Expense | - | - | - | - | - | [{"date":"2019-12-31","value":"-","profit":true},{"date":"2020-12-31","value":"-","profit":true},{"date":"2021-12-31","value":"-","profit":true},{"date":"2022-12-31","value":"-","profit":true},{"date":"2023-12-31","value":"-","profit":true}] |
| Pre-Tax Income | (107.90M) | (120.80M) | (233.60M) | (294.80M) | (229.80M) | [{"date":"2019-12-31","value":-10790000000,"profit":false},{"date":"2020-12-31","value":-12080000000,"profit":false},{"date":"2021-12-31","value":-23360000000,"profit":false},{"date":"2022-12-31","value":-29480000000,"profit":false},{"date":"2023-12-31","value":-22980000000,"profit":false}] |
| Income Taxes | 600.00K | 1.50M | 7.70M | 3.00M | 7.10M | [{"date":"2019-12-31","value":7.79,"profit":true},{"date":"2020-12-31","value":19.48,"profit":true},{"date":"2021-12-31","value":100,"profit":true},{"date":"2022-12-31","value":38.96,"profit":true},{"date":"2023-12-31","value":92.21,"profit":true}] |
| Income After Taxes | - | - | - | - | - | [{"date":"2019-12-31","value":"-","profit":true},{"date":"2020-12-31","value":"-","profit":true},{"date":"2021-12-31","value":"-","profit":true},{"date":"2022-12-31","value":"-","profit":true},{"date":"2023-12-31","value":"-","profit":true}] |
| Income From Continuous Operations | (108.50M) | (122.30M) | (241.30M) | (297.80M) | (236.90M) | [{"date":"2019-12-31","value":-10850000000,"profit":false},{"date":"2020-12-31","value":-12230000000,"profit":false},{"date":"2021-12-31","value":-24130000000,"profit":false},{"date":"2022-12-31","value":-29780000000,"profit":false},{"date":"2023-12-31","value":-23690000000,"profit":false}] |
| Income From Discontinued Operations | - | - | - | - | - | [{"date":"2019-12-31","value":"-","profit":true},{"date":"2020-12-31","value":"-","profit":true},{"date":"2021-12-31","value":"-","profit":true},{"date":"2022-12-31","value":"-","profit":true},{"date":"2023-12-31","value":"-","profit":true}] |
| Net Income | (108.50M) | (122.30M) | (241.30M) | (297.80M) | (236.90M) | [{"date":"2019-12-31","value":-10850000000,"profit":false},{"date":"2020-12-31","value":-12230000000,"profit":false},{"date":"2021-12-31","value":-24130000000,"profit":false},{"date":"2022-12-31","value":-29780000000,"profit":false},{"date":"2023-12-31","value":-23690000000,"profit":false}] |
| EPS (Diluted) | - | (6.60) | (3.87) | (4.61) | (3.41) | [{"date":"2019-12-31","value":"-","profit":true},{"date":"2020-12-31","value":-660,"profit":false},{"date":"2021-12-31","value":-387,"profit":false},{"date":"2022-12-31","value":-461,"profit":false},{"date":"2023-12-31","value":-341,"profit":false}] |
These ratios help you determine the liquidity of the company. Higher is better.
| LMND | |
|---|---|
| Cash Ratio | 4.66 |
| Current Ratio | 4.08 |
| Quick Ratio | 10.64 |
These ratios help you understand the company's efficiency in using its assets to generate returns. Higher is better. For ROE, average long term is around 14%, less than 10% is poor.
| LMND | |
|---|---|
| ROA (LTM) | -8.39% |
| ROE (LTM) | -30.07% |
These ratios help you understand the company's liabilities, gauging the riskiness of the investment.
| LMND | |
|---|---|
| Debt Ratio Lower is generally better. Negative is bad. | 0.45 |
| Common Equity/Total Assets Higher is better. Lower can suggest investment is riskier. | 0.55 |
| Debt/Equity The higher the number, the more leverage the business employs, the riskier the investment typically is. | 2.30 |
These ratios help you understand the company's valuation. Lower may indicate cheaper stocks.
| LMND | |
|---|---|
| Trailing PE | NM |
| Forward PE | NM |
| P/S (TTM) | 2.74 |
| P/B | 1.66 |
| Price/FCF | NM |
| EV/R | 2.23 |
| EV/Ebitda | NM |
| PEG | NM |
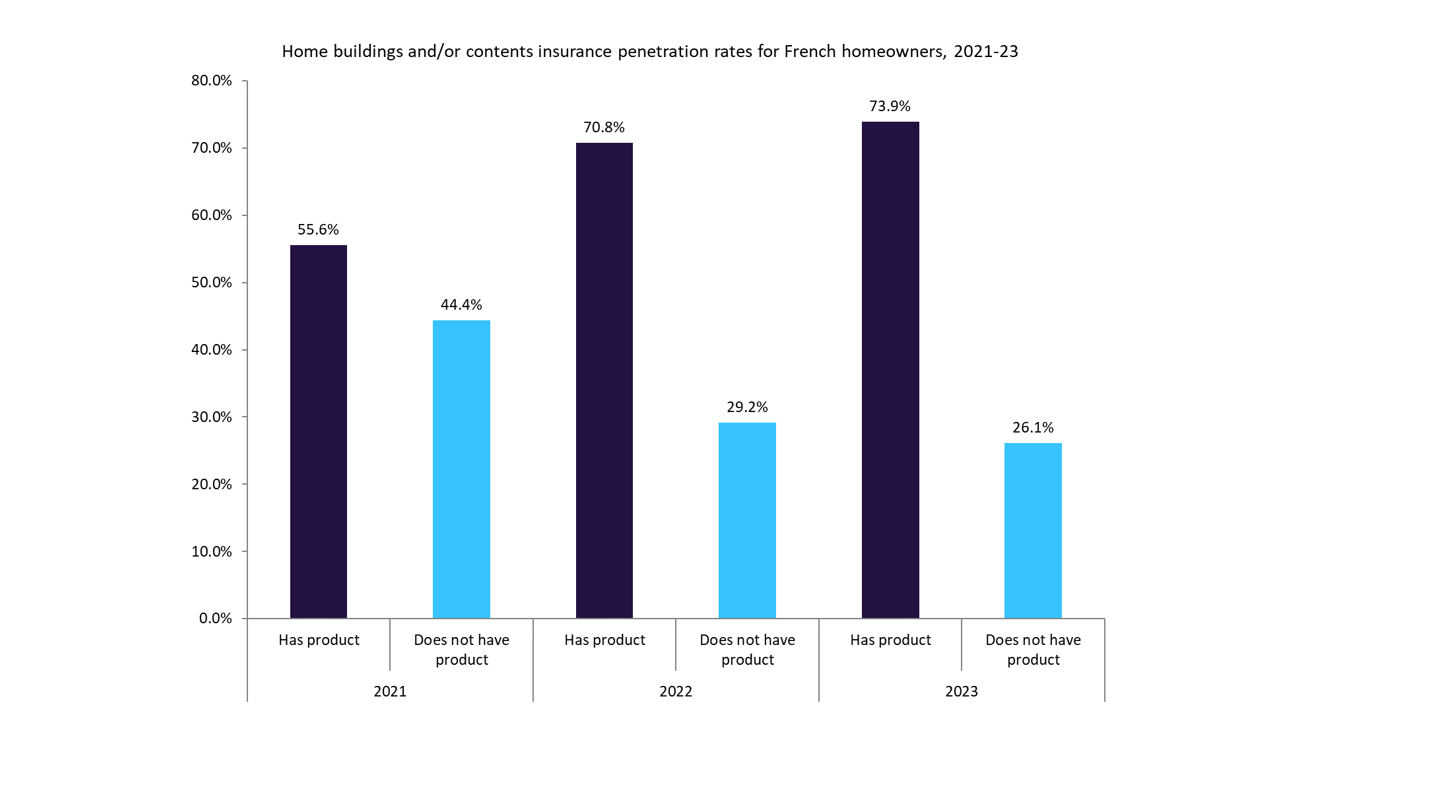
… potential policyholders. Overall, while home insurance penetration rates for French homeowners … considerable proportion who remain uninsured. Insurers can follow in Lemonade’s … of these uninsured homeowners. Additionally, insurers can also invest in targeted …

Lemonade, Inc. (NYSE: LMND) today announced it will release its first quarter 2024 financial results on Tuesday, April 30, 2024 after market close. Lemonade will host a conference call the following day, Wednesday, May 1, 2024 at 8:00 am Eastern time (5:00 am Pacific time) to discuss the results. To register for this conference call, please use this link. Registrants will receive confirmation Jetzt den vollständigen Artikel lesen


It seems like you can’t get very far these days without hearing or seeing the word AI. Artificial Intelligence, or AI, has seen explosive growth as of late. Its evolution has currently brought up many concerns about its speed of expansion and the potential elimination of much of the world’s labor force. Although many have called it the AI bubble for stocks, there is good reason to believe that this technology will truly change the world forever. Many of the world’s smartest minds have called AI the next big technology and a moment akin to the introduction of the internet. So as investors, how can we take advantage of this technological revolution? Hey, we might all be doomed anyway once the machine uprising takes place. Until then, here are three AI stocks to own in every growth portfolio. Tesla (TSLA) Source: Arina P Habich / Shutterstock.com Tesla (NASDAQ: TSLA ) is an American multinational electric vehicle maker and energy company. TSLA is easily one of the most polarizing stocks on the market.

… comprehensive protection. The new homeowners insurance proposition is tailored to the … offer Lemonade’s digital home insurance to its distribution network. Access … between Lemonade Insurance and BNP Paribas Cardif, acting as co- insurers . Lemonade …

Lemonade, a trailblazer in the digital insurance sector, has extended its repertoire of services to include homeowners insurance in France, enriching its already fruitful partnership with BNP Paribas Cardif. The post Lemonade’s game-changing homeowners insurance hits France appeared first on FinTech Global .

PARIS& NEW YORK---- Lemonade, the digital insurance company powered by AI and social impact, today announced the launch of Homeowners insurance in France in partnership with BNP Paribas Cardif. Today’ s launch builds on Lemonade’ s entrance into France in December 2020, offering AI-powered renters insurance to protect residents’ belongings. With Lemonade’ s… The post Lemonade Launches Homeowners Insurance in France appeared first on Insurance News | InsuranceNewsNet .

Lemonade, in partnership with BNP Paribas Cardif, launches fully digital AI-powered Homeowners insurance in France, expanding its offerings beyond renters insurance. The company aims to support its European growth by providing extensive coverage for homeowners with a seamless customer experience. Lemonade''s strategic move into the Homeowners insurance market in France is set to bolster its position as a multi-line insurer in Europe, leveraging its successful partnership with BNP Paribas Cardif.

Lemonade, the digital insurance company powered by AI and social impact, today announced the launch of Homeowners insurance in France in partnership with BNP Paribas Cardif. Millions of occupying homeowners can now purchase extensive coverage for their home and belongings, featuring the same seamless Lemonade experience customers have come to know and love. Today’s launch builds on Lemonade’s Jetzt den vollständigen Artikel lesen
Lemonade Inc (LMND) share price today is $17.49
Yes, Indians can buy shares of Lemonade Inc (LMND) on Vested. To buy Lemonade Inc from India, you can open a US Brokerage account on Vested today by clicking on Sign Up or Invest in LMND stock at the top of this page. The account opening process is completely digital and secure, and takes a few minutes to complete.
Yes, you can purchase fractional shares of Lemonade Inc (LMND) via the Vested app. You can start investing in Lemonade Inc (LMND) with a minimum investment of $1.
You can invest in shares of Lemonade Inc (LMND) via Vested in three simple steps:
The 52-week high price of Lemonade Inc (LMND) is $24.81. The 52-week low price of Lemonade Inc (LMND) is $10.27.
The price-to-earnings (P/E) ratio of Lemonade Inc (LMND) is NM
The price-to-book (P/B) ratio of Lemonade Inc (LMND) is 1.66
The dividend yield of Lemonade Inc (LMND) is 0.00%
The market capitalization of Lemonade Inc (LMND) is $1.23B
The stock symbol (or ticker) of Lemonade Inc is LMND
 Link copied


