

Invest in 5,000+ US Stocks and ETFs
* Offering through VF Securities, Inc. (member FINRA/SIPC)
 Skip to content
Occidental Petroleum Corporation, together with its subsidiaries, engages in the acquisition, exploration, and development of oil and gas properties in the United States, the Middle East, and North Africa. It operates through three segments: Oil and Gas, Chemical, and Midstream and Marketing. The company's Oil and Gas segment explores for, develops, and produces oil and condensate, natural gas liquids (NGLs), and natural gas. Its Chemical segment manufactures and markets basic chemicals, including chlorine, caustic soda, chlorinated organics, potassium chemicals, ethylene dichloride, chlorinated isocyanurates, sodium silicates, and calcium chloride; and vinyls comprising vinyl chloride monomer, polyvinyl chloride, and ethylene. The Midstream and Marketing segment gathers, processes, transports, stores, purchases, and markets oil, condensate, NGLs, natural gas, carbon dioxide, and power. This segment also invests in entities. Occidental Petroleum Corporation was founded in 1920 and is headquartered in Houston, Texas. more
| Time Frame | OXY | Sector | S&P500; |
|---|---|---|---|
| 1-Week Return | 2.41% | 0.7% | 0.25% |
| 1-Month Return | 12.58% | 10.59% | 0.89% |
| 3-Month Return | 21.67% | 20.49% | 8.31% |
| 6-Month Return | 10.08% | 13.59% | 18.76% |
| 1-Year Return | 8.96% | 16.92% | 27.47% |
| 3-Year Return | 193.04% | 130.64% | 30.79% |
| 5-Year Return | 15.21% | 85.02% | 93.94% |
| 10-Year Return | 2.02% | 62.3% | 241.45% |
| Dec '19 | Dec '20 | Dec '21 | Dec '22 | Dec '23 | 5YR TREND | |
|---|---|---|---|---|---|---|
| Total Revenue | 20.39B | 17.81B | 25.96B | 36.63B | 28.26B | [{"date":"2019-12-31","value":55.67,"profit":true},{"date":"2020-12-31","value":48.61,"profit":true},{"date":"2021-12-31","value":70.85,"profit":true},{"date":"2022-12-31","value":100,"profit":true},{"date":"2023-12-31","value":77.13,"profit":true}] |
| Cost of Revenue | 14.32B | 16.57B | 18.11B | 18.99B | 18.15B | [{"date":"2019-12-31","value":75.4,"profit":true},{"date":"2020-12-31","value":87.23,"profit":true},{"date":"2021-12-31","value":95.35,"profit":true},{"date":"2022-12-31","value":100,"profit":true},{"date":"2023-12-31","value":95.57,"profit":true}] |
| Gross Profit | 6.08B | 1.24B | 7.85B | 17.64B | 10.11B | [{"date":"2019-12-31","value":34.43,"profit":true},{"date":"2020-12-31","value":7.05,"profit":true},{"date":"2021-12-31","value":44.49,"profit":true},{"date":"2022-12-31","value":100,"profit":true},{"date":"2023-12-31","value":57.29,"profit":true}] |
| Gross Margin | 29.79% | 6.99% | 30.24% | 48.17% | 35.78% | [{"date":"2019-12-31","value":61.85,"profit":true},{"date":"2020-12-31","value":14.5,"profit":true},{"date":"2021-12-31","value":62.79,"profit":true},{"date":"2022-12-31","value":100,"profit":true},{"date":"2023-12-31","value":74.28,"profit":true}] |
| Operating Expenses | 3.26B | 2.50B | 3.19B | 3.98B | 3.69B | [{"date":"2019-12-31","value":81.91,"profit":true},{"date":"2020-12-31","value":62.86,"profit":true},{"date":"2021-12-31","value":80.03,"profit":true},{"date":"2022-12-31","value":100,"profit":true},{"date":"2023-12-31","value":92.84,"profit":true}] |
| Operating Income | 3.40B | (770.00M) | 5.46B | 14.61B | 4.70B | [{"date":"2019-12-31","value":23.3,"profit":true},{"date":"2020-12-31","value":-5.27,"profit":false},{"date":"2021-12-31","value":37.38,"profit":true},{"date":"2022-12-31","value":100,"profit":true},{"date":"2023-12-31","value":32.14,"profit":true}] |
| Total Non-Operating Income/Expense | (4.07B) | (16.24B) | (3.21B) | (1.37B) | 15.00M | [{"date":"2019-12-31","value":-27120,"profit":false},{"date":"2020-12-31","value":-108273.33,"profit":false},{"date":"2021-12-31","value":-21366.67,"profit":false},{"date":"2022-12-31","value":-9140,"profit":false},{"date":"2023-12-31","value":100,"profit":true}] |
| Pre-Tax Income | 186.00M | (15.71B) | 3.71B | 14.12B | 6.43B | [{"date":"2019-12-31","value":1.32,"profit":true},{"date":"2020-12-31","value":-111.25,"profit":false},{"date":"2021-12-31","value":26.24,"profit":true},{"date":"2022-12-31","value":100,"profit":true},{"date":"2023-12-31","value":45.54,"profit":true}] |
| Income Taxes | 693.00M | (2.17B) | 915.00M | 813.00M | 1.73B | [{"date":"2019-12-31","value":39.99,"profit":true},{"date":"2020-12-31","value":-125.33,"profit":false},{"date":"2021-12-31","value":52.8,"profit":true},{"date":"2022-12-31","value":46.91,"profit":true},{"date":"2023-12-31","value":100,"profit":true}] |
| Income After Taxes | (507.00M) | (13.53B) | 2.79B | 13.30B | 4.70B | [{"date":"2019-12-31","value":-3.81,"profit":false},{"date":"2020-12-31","value":-101.72,"profit":false},{"date":"2021-12-31","value":20.97,"profit":true},{"date":"2022-12-31","value":100,"profit":true},{"date":"2023-12-31","value":35.3,"profit":true}] |
| Income From Continuous Operations | (507.00M) | (13.53B) | 2.79B | 13.30B | 4.70B | [{"date":"2019-12-31","value":-3.81,"profit":false},{"date":"2020-12-31","value":-101.72,"profit":false},{"date":"2021-12-31","value":20.97,"profit":true},{"date":"2022-12-31","value":100,"profit":true},{"date":"2023-12-31","value":35.3,"profit":true}] |
| Income From Discontinued Operations | (15.00M) | (1.30B) | (468.00M) | - | - | [{"date":"2019-12-31","value":-1500000000,"profit":false},{"date":"2020-12-31","value":-129800000000,"profit":false},{"date":"2021-12-31","value":-46800000000,"profit":false},{"date":"2022-12-31","value":"-","profit":true},{"date":"2023-12-31","value":"-","profit":true}] |
| Net Income | (507.00M) | (13.53B) | 2.32B | 13.30B | 3.75B | [{"date":"2019-12-31","value":-3.81,"profit":false},{"date":"2020-12-31","value":-101.72,"profit":false},{"date":"2021-12-31","value":17.45,"profit":true},{"date":"2022-12-31","value":100,"profit":true},{"date":"2023-12-31","value":28.19,"profit":true}] |
| EPS (Diluted) | 1.62 | (3.90) | 2.52 | 9.33 | 3.69 | [{"date":"2019-12-31","value":17.36,"profit":true},{"date":"2020-12-31","value":-41.8,"profit":false},{"date":"2021-12-31","value":27.01,"profit":true},{"date":"2022-12-31","value":100,"profit":true},{"date":"2023-12-31","value":39.55,"profit":true}] |
These ratios help you determine the liquidity of the company. Higher is better.
| OXY | |
|---|---|
| Cash Ratio | 0.16 |
| Current Ratio | 0.92 |
| Quick Ratio | 0.69 |
These ratios help you understand the company's efficiency in using its assets to generate returns. Higher is better. For ROE, average long term is around 14%, less than 10% is poor.
| OXY | |
|---|---|
| ROA (LTM) | 5.09% |
| ROE (LTM) | 15.54% |
These ratios help you understand the company's liabilities, gauging the riskiness of the investment.
| OXY | |
|---|---|
| Debt Ratio Lower is generally better. Negative is bad. | 0.59 |
| Common Equity/Total Assets Higher is better. Lower can suggest investment is riskier. | 0.41 |
| Debt/Equity The higher the number, the more leverage the business employs, the riskier the investment typically is. | 2.45 |
These ratios help you understand the company's valuation. Lower may indicate cheaper stocks.
| OXY | |
|---|---|
| Trailing PE | 17.68 |
| Forward PE | 19.16 |
| P/S (TTM) | 2.16 |
| P/B | 2.78 |
| Price/FCF | 36 |
| EV/R | 3.15 |
| EV/Ebitda | 6.24 |
| PEG | NM |

Executives hold shovels during a groundbreaking ceremony at the Occidental Petroleum and 1PointFive carbon removal plant in Ector County, Texas, on April 28th, 2023. | Image: Jordan Vonderhaar / Bloomberg via Getty Images Attempting to filter enough carbon dioxide out of the atmosphere to make a significant impact on climate change would require hundreds of billions of dollars in government spending, according to a new report . The suite of technologies emerging to attempt that task all fall under an umbrella called carbon dioxide removal, or CDR. It’s still risky and astronomically expensive . But there’s been growing chatter about it, particularly as the US continues producing record amounts of oil and gas . According to the new report by research firm Rhodium Group, the US needs to spend roughly $100 billion a year on CDR in order to scale up to a level that would help the country meet its climate goals. A majority of that needs to come in the form of… Continue reading…

LOS ANGELES (dpa-AFX) - Occidental Petroleum Corp. (OXY) revealed in a Form 8-K filing with the U.S. Securities and Exchange Commission on Wednesday that that company delivered another quarter of …

Currently, crude oil is trading for over $85 a barrel. That’s a 7% gain since March 1 and a 22% gain in 2024. Those gains are mirrored in the Energy Select Sector SPDR ETF (NYSEARCA: XLE ), which has been up 16% since mid-February. And many industry analysts forecast it won’t be long before we see $100 a barrel for oil. That’s why it’s time to look at the best oil and gas stocks to buy in April. For investors in this sector, the rally in oil prices is a better late than never moment. Many investors have been piling into oil and gas stocks since 2023, expecting higher oil prices. The oil price rallied in the summer of 2023, but the gains didn’t hold. But this rally may have legs. The ISM Manufacturing Data in March rose unexpectedly, and the job market remains strong despite stubbornly high inflation and interest rates above 5%. That’s not historically high but generationally high after nearly 15 years of near-zero interest rates. Yet, the Federal Reserve seems committed to cutting interest rates sometime in 2024.
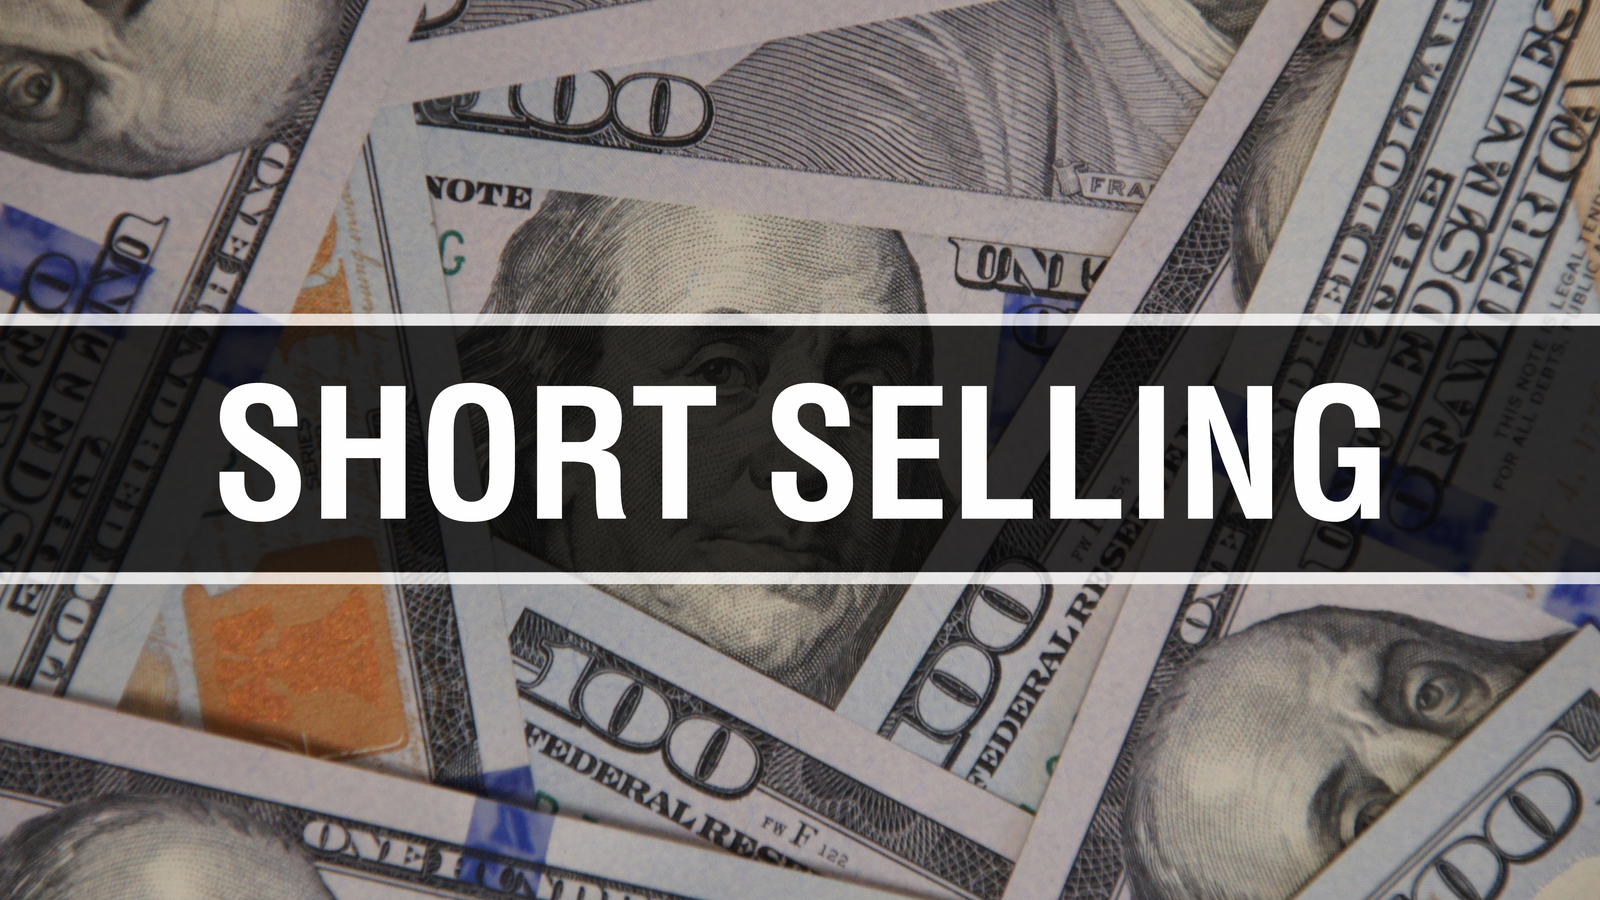
Investors are getting excited about the energy sector. The price of crude oil has topped $86 per barrel once again and is now at its highest level in months. Geopolitical uncertainty has played into the move. With the conflict in the Middle East and the ongoing problems with Russia, investors are pricing potential supply constraints into the oil market. In addition, the economy continues to run hotter than expected and inflation remains above long-term targets. This inflation-driven economic backdrop should be supportive for energy prices. It’s not just crude oil either. Investors are starting to price in the need for more electricity capacity, thanks to the surge in artificial intelligence applications. This has led to investor excitement in uranium stocks as the price of spot uranium soars. But not everyone is convinced that the skies are clear for energy stocks . Short sellers are increasing their bets against the sector. In particular, they’re picking on these companies as having significant downsides.

In this piece, I evaluated two energy stocks, Occidental Petroleum (NYSE:OXY) and Pioneer Natural Resources (NYSE:PXD), using TipRanks’ comparison …

SLB is upping its investment in an idea that Occidental Petroleum has already been working on for over a decade now.

The surge in AI and Big Tech continues capturing widespread attention, but savvy investors will want to focus on energy stocks . Energy stocks are off to an excellent start this year, with the Energy Select Sector SPDR Fund posting double-digit gains year-to-date (YTD), performing in line with tech stocks . Moreover, despite a somber outlook on the stock market, Morgan Stanley has shifted its stance on energy stocks to ‘overweight’ from ‘neutral.’ This adjustment is based on the stock prices of top energy companies that haven’t kept pace with the bullishness in the fossil fuel market. Hence, with robust prospects ahead and attractive valuations, it’s prudent to bet on the best energy stocks to buy. Best Energy Stocks to Buy: Occidental Petroleum (OXY) Source: IgorGolovniov / Shutterstock.com Oil and gas titan Occidental Petroleum (NYSE: OXY ) has established its position as a bellwether in its niche, attracting some of the biggest names in investing. It has been one of the top Warren Buffet stocks, with his investment firm Berkshire Hathaway (NYSE: BRK-A , NYSE: BRK-B ) holding a significant 27.8% stake .
Occidental Petroleum Corporation (OXY) share price today is $69.26
Yes, Indians can buy shares of Occidental Petroleum Corporation (OXY) on Vested. To buy
Yes, you can purchase fractional shares of Occidental Petroleum Corporation (OXY) via the Vested app. You can start investing in Occidental Petroleum Corporation (OXY) with a minimum investment of $1.
You can invest in shares of Occidental Petroleum Corporation (OXY) via Vested in three simple steps:
The 52-week high price of Occidental Petroleum Corporation (OXY) is $69.58. The 52-week low price of Occidental Petroleum Corporation (OXY) is $54.92.
The price-to-earnings (P/E) ratio of Occidental Petroleum Corporation (OXY) is 17.69
The price-to-book (P/B) ratio of Occidental Petroleum Corporation (OXY) is 2.78
The dividend yield of Occidental Petroleum Corporation (OXY) is 1.28%
The market capitalization of Occidental Petroleum Corporation (OXY) is $61.14B
The stock symbol (or ticker) of Occidental Petroleum Corporation is OXY
 Link copied


