

Invest in 5,000+ US Stocks and ETFs
* Offering through VF Securities, Inc. (member FINRA/SIPC)
 Skip to content
Starbucks Corporation, together with its subsidiaries, operates as a roaster, marketer, and retailer of coffee worldwide. The company operates through three segments: North America, International, and Channel Development. Its stores offer coffee and tea beverages, roasted whole beans and ground coffees, single serve products, and ready-to-drink beverages; and various food products, such as pastries, breakfast sandwiches, and lunch items. The company also licenses its trademarks through licensed stores, and grocery and foodservice accounts. The company offers its products under the Starbucks Coffee, Teavana, Seattle's Best Coffee, Ethos, Starbucks Reserve, and Princi brands. Starbucks Corporation was founded in 1971 and is based in Seattle, Washington. more
| Time Frame | SBUX | Sector | S&P500 |
|---|---|---|---|
| 1-Week Return | -15.09% | 1.14% | -0.64% |
| 1-Month Return | -15.52% | -1.14% | -2.75% |
| 3-Month Return | -19% | 1.99% | 2.89% |
| 6-Month Return | -26.16% | 11.48% | 17.07% |
| 1-Year Return | -26.34% | 23.32% | 25.71% |
| 3-Year Return | -31.08% | 2.33% | 26.45% |
| 5-Year Return | 6.15% | 55.21% | 86.7% |
| 10-Year Return | 154.46% | 211.27% | 222.9% |
| Sep '19 | Sep '20 | Sep '21 | Sep '22 | Sep '23 | 5YR TREND | |
|---|---|---|---|---|---|---|
| Total Revenue | 26.51B | 23.52B | 29.06B | 32.25B | 35.98B | [{"date":"2019-09-30","value":73.68,"profit":true},{"date":"2020-09-30","value":65.37,"profit":true},{"date":"2021-09-30","value":80.78,"profit":true},{"date":"2022-09-30","value":89.64,"profit":true},{"date":"2023-09-30","value":100,"profit":true}] |
| Cost of Revenue | 19.02B | 18.46B | 20.67B | 23.88B | 26.13B | [{"date":"2019-09-30","value":72.79,"profit":true},{"date":"2020-09-30","value":70.64,"profit":true},{"date":"2021-09-30","value":79.1,"profit":true},{"date":"2022-09-30","value":91.39,"profit":true},{"date":"2023-09-30","value":100,"profit":true}] |
| Gross Profit | 7.49B | 5.06B | 8.39B | 8.37B | 9.85B | [{"date":"2019-09-30","value":76.05,"profit":true},{"date":"2020-09-30","value":51.38,"profit":true},{"date":"2021-09-30","value":85.22,"profit":true},{"date":"2022-09-30","value":85.02,"profit":true},{"date":"2023-09-30","value":100,"profit":true}] |
| Gross Margin | 28.25% | 21.51% | 28.87% | 25.96% | 27.37% | [{"date":"2019-09-30","value":97.83,"profit":true},{"date":"2020-09-30","value":74.5,"profit":true},{"date":"2021-09-30","value":100,"profit":true},{"date":"2022-09-30","value":89.9,"profit":true},{"date":"2023-09-30","value":94.79,"profit":true}] |
| Operating Expenses | 3.57B | 3.54B | 3.73B | 3.94B | 4.34B | [{"date":"2019-09-30","value":82.25,"profit":true},{"date":"2020-09-30","value":81.53,"profit":true},{"date":"2021-09-30","value":85.97,"profit":true},{"date":"2022-09-30","value":90.75,"profit":true},{"date":"2023-09-30","value":100,"profit":true}] |
| Operating Income | 4.08B | 1.56B | 4.87B | 4.62B | 5.87B | [{"date":"2019-09-30","value":69.46,"profit":true},{"date":"2020-09-30","value":26.6,"profit":true},{"date":"2021-09-30","value":82.99,"profit":true},{"date":"2022-09-30","value":78.66,"profit":true},{"date":"2023-09-30","value":100,"profit":true}] |
| Total Non-Operating Income/Expense | 153.80M | (794.60M) | 105.10M | (771.80M) | (101.00M) | [{"date":"2019-09-30","value":100,"profit":true},{"date":"2020-09-30","value":-516.64,"profit":false},{"date":"2021-09-30","value":68.34,"profit":true},{"date":"2022-09-30","value":-501.82,"profit":false},{"date":"2023-09-30","value":-65.67,"profit":false}] |
| Pre-Tax Income | 4.47B | 1.16B | 5.36B | 4.23B | 5.40B | [{"date":"2019-09-30","value":82.68,"profit":true},{"date":"2020-09-30","value":21.56,"profit":true},{"date":"2021-09-30","value":99.17,"profit":true},{"date":"2022-09-30","value":78.34,"profit":true},{"date":"2023-09-30","value":100,"profit":true}] |
| Income Taxes | 871.60M | 239.70M | 1.16B | 948.50M | 1.28B | [{"date":"2019-09-30","value":68.24,"profit":true},{"date":"2020-09-30","value":18.77,"profit":true},{"date":"2021-09-30","value":90.56,"profit":true},{"date":"2022-09-30","value":74.26,"profit":true},{"date":"2023-09-30","value":100,"profit":true}] |
| Income After Taxes | 3.59B | 924.70M | 4.20B | 3.28B | 4.12B | [{"date":"2019-09-30","value":85.58,"profit":true},{"date":"2020-09-30","value":22.02,"profit":true},{"date":"2021-09-30","value":100,"profit":true},{"date":"2022-09-30","value":78.17,"profit":true},{"date":"2023-09-30","value":98.2,"profit":true}] |
| Income From Continuous Operations | 3.59B | 924.70M | 4.20B | 3.28B | 4.12B | [{"date":"2019-09-30","value":85.58,"profit":true},{"date":"2020-09-30","value":22.02,"profit":true},{"date":"2021-09-30","value":100,"profit":true},{"date":"2022-09-30","value":78.17,"profit":true},{"date":"2023-09-30","value":98.2,"profit":true}] |
| Income From Discontinued Operations | - | - | - | - | - | [{"date":"2019-09-30","value":"-","profit":true},{"date":"2020-09-30","value":"-","profit":true},{"date":"2021-09-30","value":"-","profit":true},{"date":"2022-09-30","value":"-","profit":true},{"date":"2023-09-30","value":"-","profit":true}] |
| Net Income | 3.60B | 928.30M | 4.20B | 3.28B | 4.12B | [{"date":"2019-09-30","value":85.71,"profit":true},{"date":"2020-09-30","value":22.11,"profit":true},{"date":"2021-09-30","value":100,"profit":true},{"date":"2022-09-30","value":78.15,"profit":true},{"date":"2023-09-30","value":98.22,"profit":true}] |
| EPS (Diluted) | 2.76 | 1.16 | 3.24 | 2.96 | 3.55 | [{"date":"2019-09-30","value":77.75,"profit":true},{"date":"2020-09-30","value":32.68,"profit":true},{"date":"2021-09-30","value":91.27,"profit":true},{"date":"2022-09-30","value":83.38,"profit":true},{"date":"2023-09-30","value":100,"profit":true}] |
These ratios help you determine the liquidity of the company. Higher is better.
| SBUX | |
|---|---|
| Cash Ratio | 0.42 |
| Current Ratio | 0.86 |
| Quick Ratio | 0.63 |
These ratios help you understand the company's efficiency in using its assets to generate returns. Higher is better. For ROE, average long term is around 14%, less than 10% is poor.
| SBUX | |
|---|---|
| ROA (LTM) | 12.06% |
| ROE (LTM) | 0.00% |
These ratios help you understand the company's liabilities, gauging the riskiness of the investment.
| SBUX | |
|---|---|
| Debt Ratio Lower is generally better. Negative is bad. | 1.29 |
| Common Equity/Total Assets Higher is better. Lower can suggest investment is riskier. | -0.29 |
| Debt/Equity The higher the number, the more leverage the business employs, the riskier the investment typically is. | -3.48 |
These ratios help you understand the company's valuation. Lower may indicate cheaper stocks.
| SBUX | |
|---|---|
| Trailing PE | 20.64 |
| Forward PE | 20.79 |
| P/S (TTM) | 2.62 |
| P/B | 0.00 |
| Price/FCF | 52 |
| EV/R | 3.20 |
| EV/Ebitda | 15.23 |
| PEG | 1.15 |
Starbucks has had a disastrous start to the year - with tens of millions of customers heading instead to rivals or staying at home.

Starbucks experiencing headwinds as customers pull back spending.
Do you believe a turnaround is coming?
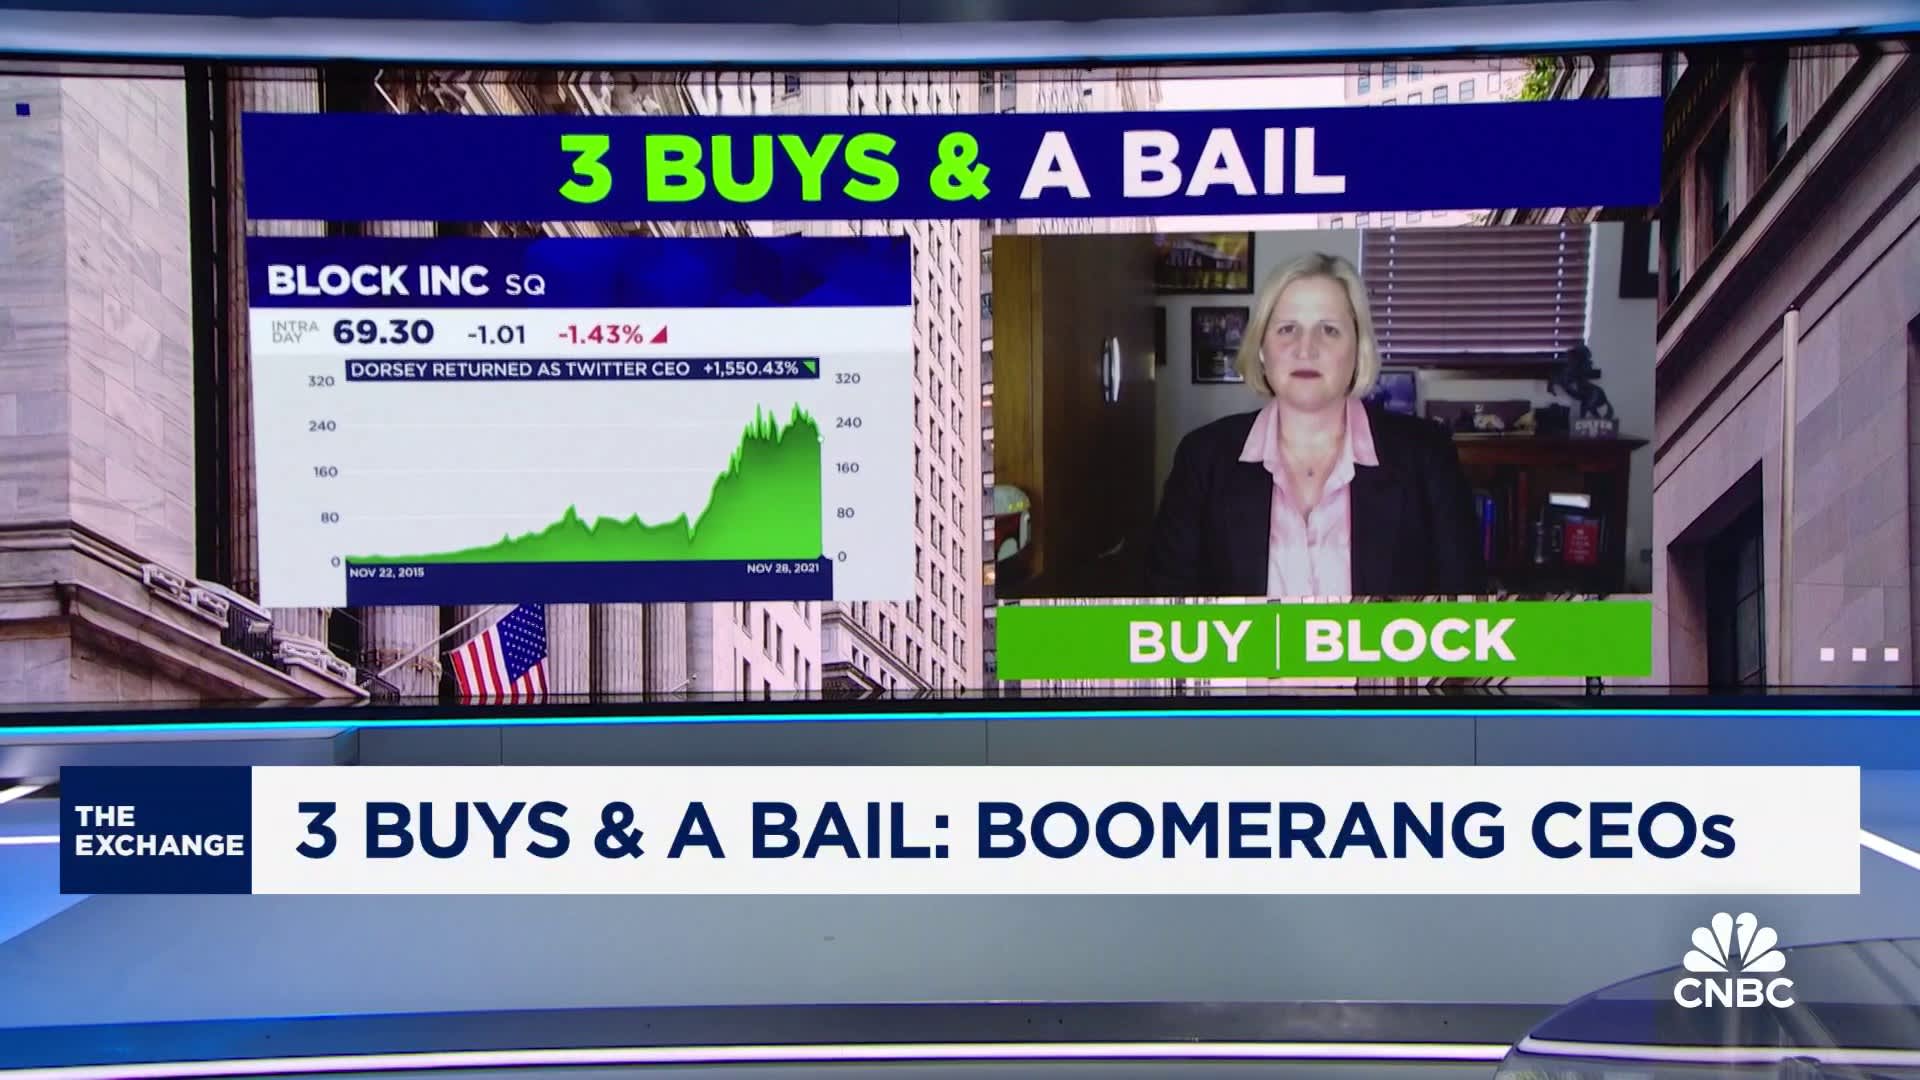
Victoria Greene, G Squared Private Wealth CIO, joins CNBC''s ''The Exchange'' to discuss how to play three companies that have re-hired their former CEOs: Square, Disney, Under Armour, and Starbucks.

Finding stocks ready for a comeback is crucial for investors looking for growth and value in today’s dynamic market environment. The first one stands out due to its substantial increase in transaction volume and growing market penetration. The company exhibits operational efficiency and a strong foothold in the transaction and payment processing services industry, with a rise in transaction margin dollars and a steady development in total payment volume (TPV). Meanwhile, thanks to its worldwide development and strategic investments, the second one has become a contender in the streaming market and a symbol of resilience. By focusing on increasing the profitability of its streaming division, the company has generated positive EBITDA and a notable increase in subscriber-related revenue, showcasing its ability to adapt and thrive in a competitive market. Lastly, the third one stands out as a strong brand with a solid worldwide presence and creative bent. Despite obstacles, the business continues to dominate the coffee sector, exhibiting great store development skills and utilizing digital efforts to boost consumer interaction and sales.

The coffee giant had some bad news for investors on Tuesday.
Starbucks Corporation (SBUX) share price today is $73.11
Yes, Indians can buy shares of Starbucks Corporation (SBUX) on Vested. To buy Starbucks Corporation from India, you can open a US Brokerage account on Vested today by clicking on Sign Up or Invest in SBUX stock at the top of this page. The account opening process is completely digital and secure, and takes a few minutes to complete.
Yes, you can purchase fractional shares of Starbucks Corporation (SBUX) via the Vested app. You can start investing in Starbucks Corporation (SBUX) with a minimum investment of $1.
You can invest in shares of Starbucks Corporation (SBUX) via Vested in three simple steps:
The 52-week high price of Starbucks Corporation (SBUX) is $107.02. The 52-week low price of Starbucks Corporation (SBUX) is $72.67.
The price-to-earnings (P/E) ratio of Starbucks Corporation (SBUX) is 20.14
The price-to-book (P/B) ratio of Starbucks Corporation (SBUX) is 0.00
The dividend yield of Starbucks Corporation (SBUX) is 3.04%
The market capitalization of Starbucks Corporation (SBUX) is $82.81B
The stock symbol (or ticker) of Starbucks Corporation is SBUX
 Link copied


