

Invest in 5,000+ US Stocks and ETFs
* Offering through VF Securities, Inc. (member FINRA/SIPC)
 Skip to content
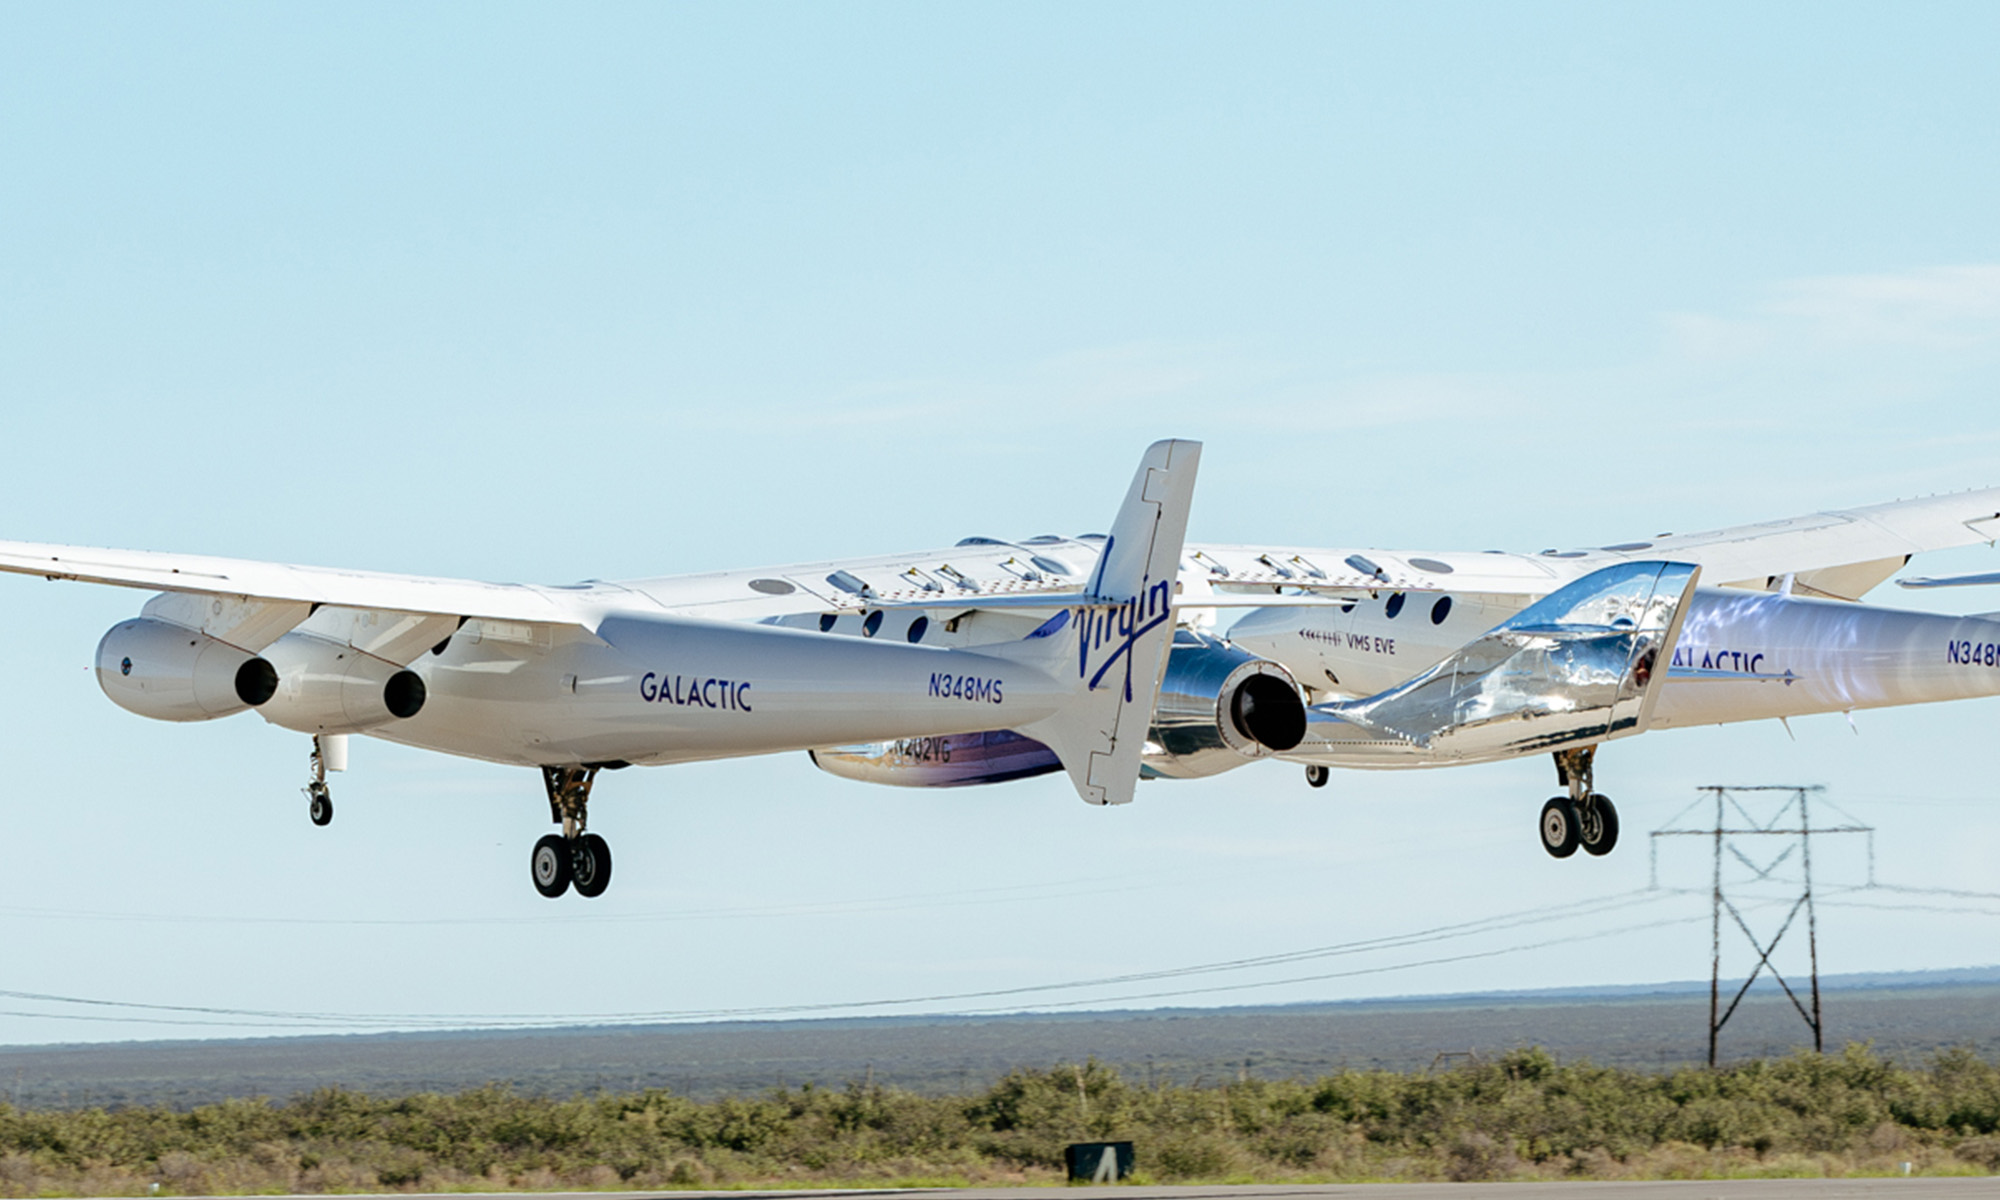
Virgin Galactic Holdings, Inc., an aerospace and space travel company, focuses on the development, manufacture, and operation of spaceships and related technologies. The company engages in the design and development, manufacturing, ground and flight testing, spaceflight operation, and post-flight maintenance of spaceflight systems for private individuals, researchers, and government agencies. Virgin Galactic Holdings, Inc. is headquartered in Tustin, California. more
| Time Frame | SPCE | Sector | S&P500; |
|---|---|---|---|
| 1-Week Return | -20.73% | - | - |
| 1-Month Return | -38.85% | -1.82% | -3.5% |
| 3-Month Return | -55.41% | 7.66% | 3.86% |
| 6-Month Return | -51.08% | 22.05% | 17.98% |
| 1-Year Return | -76.29% | 21.48% | 22.44% |
| 3-Year Return | -96.19% | 25.73% | 25.9% |
| 5-Year Return | -91.63% | 68.46% | 86.97% |
| 10-Year Return | -91.52% | 175.29% | 221.66% |
| Dec '19 | Dec '20 | Dec '21 | Dec '22 | Dec '23 | 5YR TREND | |
|---|---|---|---|---|---|---|
| Total Revenue | 3.78M | 238.00K | 3.29M | 2.31M | 6.80M | [{"date":"2019-12-31","value":55.6,"profit":true},{"date":"2020-12-31","value":3.5,"profit":true},{"date":"2021-12-31","value":48.41,"profit":true},{"date":"2022-12-31","value":34,"profit":true},{"date":"2023-12-31","value":100,"profit":true}] |
| Cost of Revenue | 2.00M | 173.00K | 272.00K | 1.91M | 50.54M | [{"date":"2019-12-31","value":3.97,"profit":true},{"date":"2020-12-31","value":0.34,"profit":true},{"date":"2021-12-31","value":0.54,"profit":true},{"date":"2022-12-31","value":3.77,"profit":true},{"date":"2023-12-31","value":100,"profit":true}] |
| Gross Profit | 1.78M | 65.00K | 3.02M | 406.00K | (43.74M) | [{"date":"2019-12-31","value":58.84,"profit":true},{"date":"2020-12-31","value":2.15,"profit":true},{"date":"2021-12-31","value":100,"profit":true},{"date":"2022-12-31","value":13.44,"profit":true},{"date":"2023-12-31","value":-1448.28,"profit":false}] |
| Gross Margin | 47.00% | 27.31% | 91.74% | 17.56% | (643.21%) | [{"date":"2019-12-31","value":51.23,"profit":true},{"date":"2020-12-31","value":29.77,"profit":true},{"date":"2021-12-31","value":100,"profit":true},{"date":"2022-12-31","value":19.14,"profit":true},{"date":"2023-12-31","value":-701.14,"profit":false}] |
| Operating Expenses | 215.04M | 275.35M | 322.56M | 500.39M | 483.37M | [{"date":"2019-12-31","value":42.97,"profit":true},{"date":"2020-12-31","value":55.03,"profit":true},{"date":"2021-12-31","value":64.46,"profit":true},{"date":"2022-12-31","value":100,"profit":true},{"date":"2023-12-31","value":96.6,"profit":true}] |
| Operating Income | (213.26M) | (275.28M) | (319.54M) | (499.98M) | (531.51M) | [{"date":"2019-12-31","value":-21326200000,"profit":false},{"date":"2020-12-31","value":-27528400000,"profit":false},{"date":"2021-12-31","value":-31953500000,"profit":false},{"date":"2022-12-31","value":-49998400000,"profit":false},{"date":"2023-12-31","value":-53150900000,"profit":false}] |
| Total Non-Operating Income/Expense | 4.65M | 4.50M | (32.10M) | 802.00K | 17.78M | [{"date":"2019-12-31","value":26.16,"profit":true},{"date":"2020-12-31","value":25.29,"profit":true},{"date":"2021-12-31","value":-180.59,"profit":false},{"date":"2022-12-31","value":4.51,"profit":true},{"date":"2023-12-31","value":100,"profit":true}] |
| Pre-Tax Income | (210.87M) | (273.03M) | (352.82M) | (499.55M) | (501.88M) | [{"date":"2019-12-31","value":-21087300000,"profit":false},{"date":"2020-12-31","value":-27302900000,"profit":false},{"date":"2021-12-31","value":-35282000000,"profit":false},{"date":"2022-12-31","value":-49955400000,"profit":false},{"date":"2023-12-31","value":-50188400000,"profit":false}] |
| Income Taxes | 62.00K | 6.00K | 79.00K | 598.00K | 453.00K | [{"date":"2019-12-31","value":10.37,"profit":true},{"date":"2020-12-31","value":1,"profit":true},{"date":"2021-12-31","value":13.21,"profit":true},{"date":"2022-12-31","value":100,"profit":true},{"date":"2023-12-31","value":75.75,"profit":true}] |
| Income After Taxes | (210.94M) | (273.04M) | (352.90M) | (500.15M) | (502.34M) | [{"date":"2019-12-31","value":-21093500000,"profit":false},{"date":"2020-12-31","value":-27303500000,"profit":false},{"date":"2021-12-31","value":-35289900000,"profit":false},{"date":"2022-12-31","value":-50015200000,"profit":false},{"date":"2023-12-31","value":-50233700000,"profit":false}] |
| Income From Continuous Operations | (210.94M) | (273.04M) | (352.90M) | (500.15M) | (549.17M) | [{"date":"2019-12-31","value":-21093500000,"profit":false},{"date":"2020-12-31","value":-27303500000,"profit":false},{"date":"2021-12-31","value":-35289900000,"profit":false},{"date":"2022-12-31","value":-50015200000,"profit":false},{"date":"2023-12-31","value":-54917300000,"profit":false}] |
| Income From Discontinued Operations | - | - | - | - | - | [{"date":"2019-12-31","value":"-","profit":true},{"date":"2020-12-31","value":"-","profit":true},{"date":"2021-12-31","value":"-","profit":true},{"date":"2022-12-31","value":"-","profit":true},{"date":"2023-12-31","value":"-","profit":true}] |
| Net Income | (210.94M) | (273.04M) | (352.90M) | (500.15M) | (502.34M) | [{"date":"2019-12-31","value":-21093500000,"profit":false},{"date":"2020-12-31","value":-27303500000,"profit":false},{"date":"2021-12-31","value":-35289900000,"profit":false},{"date":"2022-12-31","value":-50015200000,"profit":false},{"date":"2023-12-31","value":-50233700000,"profit":false}] |
| EPS (Diluted) | (0.60) | (1.25) | (1.57) | (1.89) | (1.57) | [{"date":"2019-12-31","value":-60.34,"profit":false},{"date":"2020-12-31","value":-125,"profit":false},{"date":"2021-12-31","value":-157,"profit":false},{"date":"2022-12-31","value":-189,"profit":false},{"date":"2023-12-31","value":-157,"profit":false}] |
These ratios help you determine the liquidity of the company. Higher is better.
| SPCE | |
|---|---|
| Cash Ratio | 4.71 |
| Current Ratio | 5.12 |
| Quick Ratio | 5.03 |
These ratios help you understand the company's efficiency in using its assets to generate returns. Higher is better. For ROE, average long term is around 14%, less than 10% is poor.
| SPCE | |
|---|---|
| ROA (LTM) | -28.41% |
| ROE (LTM) | -101.93% |
These ratios help you understand the company's liabilities, gauging the riskiness of the investment.
| SPCE | |
|---|---|
| Debt Ratio Lower is generally better. Negative is bad. | 0.57 |
| Common Equity/Total Assets Higher is better. Lower can suggest investment is riskier. | 0.43 |
| Debt/Equity The higher the number, the more leverage the business employs, the riskier the investment typically is. | 2.33 |
These ratios help you understand the company's valuation. Lower may indicate cheaper stocks.
| SPCE | |
|---|---|
| Trailing PE | NM |
| Forward PE | NM |
| P/S (TTM) | 63.54 |
| P/B | 0.85 |
| Price/FCF | NM |
| EV/R | 1.75 |
| EV/Ebitda | 0.05 |
| PEG | NM |

Virgin Galactic wants to reverse-split its stock. Should you be scared?

These three best space stocks to buy don’t just provide revolutionary space exploration technology. They also focus on other complementary industries, including the defense space and commercial flights. Boeing (NYSE: BA ), for example, is known for making planes for commercial flights. However, the company also offers various defense solutions, such as missile defense systems, satellites and more, catering to the needs of governments and militaries globally. Similarly, Northrop Grumman (NYSE: NOC ) is a defense contractor providing a comprehensive range of aerospace and defense solutions. Finally, Virgin Galactic (NYSE: SPCE ) is on the cutting edge of the nascent commercial space flight industry. Importantly, many hedge funds and institutional investors — including Millennium Management and Fisher Asset Management — have significant positions in these companies. Here’s why investors should consider a stake in these best space stocks to buy, too. Best Space Stocks to Buy: Boeing (BA) Source: vaalaa / Shutterstock Right now, Boeing stock trades at around $168 per share, marking its new 52-week low.

How would you like to turn a $100,000 investment into $1 million? This may become a reality with a space stocks bet. Although doing so would require significant growth over the next 10-15 years, they have potential to deliver outsized returns. The question is – are you a patient, risk-tolerant investor? Over the past decade, we’ve witnessed a transformation in the space economy, driven by rapid leaps in technology and falling launch costs. But of course, investing in space ventures is not without its risks. The industry is highly capital-intensive and subject to technical challenges. Any failed launch or other black swan event can be a catastrophe for the company’s stock price. In turn, this can make them volatile and occasionally destructive to an investor’s portfolio. Regardless, many believe in a bright future for space stocks. And investors who get in early with a sizable investment will be rewarded handsomely. So let’s examine three space stocks for investors to consider to turn $100,000 into seven figures.

There are some great space stocks to buy in April. While investor attention is turned to sectors such as artificial intelligence and renewable energy, the space industry is also presenting some great buys for investors to capitalize on. The commercial space industry has seen significant growth, I think the best is yet to come. This is driven by the rise of private space companies and increased investment in space exploration and development. The growing demand for satellite-based services, such as Earth observation, communication, and navigation, has also created significant opportunities in the space industry. I think that we’ve only just started to see the future diversity present with numerous firms entering the space race. The good thing about space stocks is that they operate in cyclical, and often diversified industries as well, compassing sectors that range from industrials through to defense, which can act as an inbuilt hedge against the speculative nature of industry. So here are three space stocks to buy in April for investors.

It''s hard for unprofitable space stocks to fight "gravity" when Fed interest rates are too high.

An underappreciated part of investing is knowing when to cut your losses. No one bats a thousand in this field; even the best investors make some bad picks and come up with ideas that don’t pan out from time to time. It’s one thing to get a pick wrong. It’s quite another thing to stay wrong. Further to that, there’s no reason to be loyal to a stock just because you already own it. In fact, investors should pay special attention to make sure they don’t fall prey to sunk cost fallacy . It’s never too late to dump a bad investment and reallocate the funds to a more promising opportunity. These are seven struggling stocks to avoid; investors should dump these companies now before things go from bad to worse. GameStop (GME) Source: shutterstock.com/EchoVisuals GameStop (NYSE: GME ) was one of the most improbable stock market events of the past decade. Shares rose as much as 100-fold from the lows during its historic short squeeze. The event became so famous that a documentary was made about it.

Space stocks attract investors for two principal reasons: space tourism and space exploration. Because space tourism is so young, the market size is hard to peg, but Grand View Research is forecasting a 45% CAGR from 2024 to 2030, eventually leading to a $10 billion valuation. The benefits of space exploration are similarly hard to measure. However, the resources in the asteroid belt between Mars and Jupiter alone are worth an estimated $700 quintillion . I take all of these estimates with a grain of salt, but one thing is certain: Space is uncharted territory offering rich returns, with North America leading the market. Virgin Galactic (SPCE) Source: rafapress / Shutterstock.com After completing its 11th successful spaceflight — and its first in 2024 — Virgin Galactic (NYSE: SPCE ) looked to lead space stocks this year. However, it’s in hot waters thanks to a Boeing (NYSE: BA ) lawsuit , which could cause delays in the commencement of commercial Delta class spaceflights slated for 2026.
When Virgin Galactic started selling tickets it charged $200,000. The price has gone up a lot since then, but it hasn''t dented demand.

The stock is down, but is the news that bad at Virgin Galactic?
Virgin Galactic Holdings Inc (SPCE) share price today is $0.8561
Yes, Indians can buy shares of Virgin Galactic Holdings Inc (SPCE) on Vested. To buy Virgin Galactic Holdings Inc from India, you can open a US Brokerage account on Vested today by clicking on Sign Up or Invest in SPCE stock at the top of this page. The account opening process is completely digital and secure, and takes a few minutes to complete.
Yes, you can purchase fractional shares of Virgin Galactic Holdings Inc (SPCE) via the Vested app. You can start investing in Virgin Galactic Holdings Inc (SPCE) with a minimum investment of $1.
You can invest in shares of Virgin Galactic Holdings Inc (SPCE) via Vested in three simple steps:
The 52-week high price of Virgin Galactic Holdings Inc (SPCE) is $6.17. The 52-week low price of Virgin Galactic Holdings Inc (SPCE) is $0.9.
The price-to-earnings (P/E) ratio of Virgin Galactic Holdings Inc (SPCE) is NM
The price-to-book (P/B) ratio of Virgin Galactic Holdings Inc (SPCE) is 0.85
The dividend yield of Virgin Galactic Holdings Inc (SPCE) is 0.00%
The market capitalization of Virgin Galactic Holdings Inc (SPCE) is $342.47M
The stock symbol (or ticker) of Virgin Galactic Holdings Inc is SPCE
 Link copied


