

Invest in 5,000+ US Stocks and ETFs
* Offering through VF Securities, Inc. (member FINRA/SIPC)
 Skip to content
Tesla, Inc. designs, develops, manufactures, leases, and sells electric vehicles, and energy generation and storage systems in the United States, China, and internationally. The company operates in two segments, Automotive, and Energy Generation and Storage. The Automotive segment offers electric vehicles, as well as sells automotive regulatory credits; and non-warranty after-sales vehicle, used vehicles, body shop and parts, supercharging, retail merchandise, and vehicle insurance services. This segment also provides sedans and sport utility vehicles through direct and used vehicle sales, a network of Tesla Superchargers, and in-app upgrades; purchase financing and leasing services; services for electric vehicles through its company-owned service locations and Tesla mobile service technicians; and vehicle limited warranties and extended service plans. The Energy Generation and Storage segment engages in the design, manufacture, installation, sale, and leasing of solar energy generation and energy storage products, and related services to residential, commercial, and industrial customers and utilities through its website, stores, and galleries, as well as through a network of channel partners; and provision of service and repairs to its energy product customers, including under warranty, as well as various financing options to its solar customers. The company was formerly known as Tesla Motors, Inc. and changed its name to Tesla, Inc. in February 2017. Tesla, Inc. was incorporated in 2003 and is headquartered in Austin, Texas. more
| Time Frame | TSLA | Sector | S&P500 |
|---|---|---|---|
| 1-Week Return | 7.56% | 1.14% | -0.64% |
| 1-Month Return | 7.51% | -1.14% | -2.75% |
| 3-Month Return | -0.02% | 1.99% | 2.89% |
| 6-Month Return | -17.7% | 11.48% | 17.07% |
| 1-Year Return | 12.71% | 23.32% | 25.71% |
| 3-Year Return | -20.71% | 2.33% | 26.45% |
| 5-Year Return | 964.7% | 55.21% | 86.7% |
| 10-Year Return | 1153.54% | 211.27% | 222.9% |
| Dec '19 | Dec '20 | Dec '21 | Dec '22 | Dec '23 | 5YR TREND | |
|---|---|---|---|---|---|---|
| Total Revenue | 24.58B | 31.54B | 53.82B | 81.46B | 96.77B | [{"date":"2019-12-31","value":25.4,"profit":true},{"date":"2020-12-31","value":32.59,"profit":true},{"date":"2021-12-31","value":55.62,"profit":true},{"date":"2022-12-31","value":84.18,"profit":true},{"date":"2023-12-31","value":100,"profit":true}] |
| Cost of Revenue | 20.51B | 24.91B | 40.22B | 60.61B | 79.11B | [{"date":"2019-12-31","value":25.92,"profit":true},{"date":"2020-12-31","value":31.48,"profit":true},{"date":"2021-12-31","value":50.83,"profit":true},{"date":"2022-12-31","value":76.61,"profit":true},{"date":"2023-12-31","value":100,"profit":true}] |
| Gross Profit | 4.07B | 6.63B | 13.61B | 20.85B | 17.66B | [{"date":"2019-12-31","value":19.51,"profit":true},{"date":"2020-12-31","value":31.79,"profit":true},{"date":"2021-12-31","value":65.25,"profit":true},{"date":"2022-12-31","value":100,"profit":true},{"date":"2023-12-31","value":84.69,"profit":true}] |
| Gross Margin | 16.56% | 21.02% | 25.28% | 25.60% | 18.25% | [{"date":"2019-12-31","value":64.67,"profit":true},{"date":"2020-12-31","value":82.13,"profit":true},{"date":"2021-12-31","value":98.75,"profit":true},{"date":"2022-12-31","value":100,"profit":true},{"date":"2023-12-31","value":71.29,"profit":true}] |
| Operating Expenses | 3.99B | 4.64B | 7.11B | 7.02B | 8.77B | [{"date":"2019-12-31","value":45.49,"profit":true},{"date":"2020-12-31","value":52.87,"profit":true},{"date":"2021-12-31","value":81.08,"profit":true},{"date":"2022-12-31","value":80.07,"profit":true},{"date":"2023-12-31","value":100,"profit":true}] |
| Operating Income | 169.00M | 1.99B | 6.69B | 13.66B | 8.89B | [{"date":"2019-12-31","value":1.24,"profit":true},{"date":"2020-12-31","value":14.6,"profit":true},{"date":"2021-12-31","value":48.97,"profit":true},{"date":"2022-12-31","value":100,"profit":true},{"date":"2023-12-31","value":65.11,"profit":true}] |
| Total Non-Operating Income/Expense | (1.48B) | (1.56B) | (659.00M) | 169.00M | 1.08B | [{"date":"2019-12-31","value":-136.32,"profit":false},{"date":"2020-12-31","value":-143.99,"profit":false},{"date":"2021-12-31","value":-60.91,"profit":false},{"date":"2022-12-31","value":15.62,"profit":true},{"date":"2023-12-31","value":100,"profit":true}] |
| Pre-Tax Income | (665.00M) | 1.15B | 6.34B | 13.72B | 9.97B | [{"date":"2019-12-31","value":-4.85,"profit":false},{"date":"2020-12-31","value":8.41,"profit":true},{"date":"2021-12-31","value":46.24,"profit":true},{"date":"2022-12-31","value":100,"profit":true},{"date":"2023-12-31","value":72.69,"profit":true}] |
| Income Taxes | 110.00M | 292.00M | 699.00M | 1.13B | (5.00B) | [{"date":"2019-12-31","value":9.72,"profit":true},{"date":"2020-12-31","value":25.8,"profit":true},{"date":"2021-12-31","value":61.75,"profit":true},{"date":"2022-12-31","value":100,"profit":true},{"date":"2023-12-31","value":-441.78,"profit":false}] |
| Income After Taxes | (775.00M) | 862.00M | 5.64B | 12.59B | 14.97B | [{"date":"2019-12-31","value":-5.18,"profit":false},{"date":"2020-12-31","value":5.76,"profit":true},{"date":"2021-12-31","value":37.69,"profit":true},{"date":"2022-12-31","value":84.06,"profit":true},{"date":"2023-12-31","value":100,"profit":true}] |
| Income From Continuous Operations | (775.00M) | 862.00M | 5.64B | 12.59B | 14.97B | [{"date":"2019-12-31","value":-5.18,"profit":false},{"date":"2020-12-31","value":5.76,"profit":true},{"date":"2021-12-31","value":37.69,"profit":true},{"date":"2022-12-31","value":84.06,"profit":true},{"date":"2023-12-31","value":100,"profit":true}] |
| Income From Discontinued Operations | - | - | - | - | - | [{"date":"2019-12-31","value":"-","profit":true},{"date":"2020-12-31","value":"-","profit":true},{"date":"2021-12-31","value":"-","profit":true},{"date":"2022-12-31","value":"-","profit":true},{"date":"2023-12-31","value":"-","profit":true}] |
| Net Income | (775.00M) | 721.00M | 5.52B | 12.58B | 15.00B | [{"date":"2019-12-31","value":-5.17,"profit":false},{"date":"2020-12-31","value":4.81,"profit":true},{"date":"2021-12-31","value":36.83,"profit":true},{"date":"2022-12-31","value":83.89,"profit":true},{"date":"2023-12-31","value":100,"profit":true}] |
| EPS (Diluted) | 0.07 | 0.75 | 2.26 | 4.07 | 3.13 | [{"date":"2019-12-31","value":1.72,"profit":true},{"date":"2020-12-31","value":18.43,"profit":true},{"date":"2021-12-31","value":55.53,"profit":true},{"date":"2022-12-31","value":100,"profit":true},{"date":"2023-12-31","value":76.9,"profit":true}] |
These ratios help you determine the liquidity of the company. Higher is better.
| TSLA | |
|---|---|
| Cash Ratio | 0.92 |
| Current Ratio | 1.72 |
| Quick Ratio | 1.17 |
These ratios help you understand the company's efficiency in using its assets to generate returns. Higher is better. For ROE, average long term is around 14%, less than 10% is poor.
| TSLA | |
|---|---|
| ROA (LTM) | 4.72% |
| ROE (LTM) | 23.74% |
These ratios help you understand the company's liabilities, gauging the riskiness of the investment.
| TSLA | |
|---|---|
| Debt Ratio Lower is generally better. Negative is bad. | 0.40 |
| Common Equity/Total Assets Higher is better. Lower can suggest investment is riskier. | 0.59 |
| Debt/Equity The higher the number, the more leverage the business employs, the riskier the investment typically is. | 1.70 |
These ratios help you understand the company's valuation. Lower may indicate cheaper stocks.
| TSLA | |
|---|---|
| Trailing PE | 46.04 |
| Forward PE | 57.80 |
| P/S (TTM) | 5.63 |
| P/B | 8.70 |
| Price/FCF | NM |
| EV/R | 5.43 |
| EV/Ebitda | 35.50 |
| PEG | 2.74 |

Tesla''s Cybertruck doesn''t appear as "apocalypse-proof" as Elon Musk first suggested. Since its November debut, the vehicles have gotten stuck in rough terrain and are facing recalls. When the $80,000+ car was first revealed, its windows were smashed during a live demonstration. Tesla''s Cybertruck hasn''t had quite the debut Elon Musk said it would. Since its November launch, the $80,0000+ vehicle has repeatedly made headlines for issues including displaying inexplicable " critical steering error " warning alerts, becoming stuck in rough terrain, and facing widespread recalls — a far cry from being the " apocalypse-proof " behemoth it was touted as. "If you''re ever in an argument with another car," Elon Musk pledged at the truck''s launch event last year, "you will win." He added: "The apocalypse could come along at any moment, and here at Tesla, we have the finest in apocalypse technology ." But on May 2, a tourist on Nantucket found their Cybertruck trapped in the sand, requiring a tow truck to free it.

LET ME DO YOUR 2023 TAXES:https://www.dropbox.com/scl/fi/vxcwnzulb26l65r1covac/Tax-Presentation.pptx?rlkey=ccrtkw1u82r45glkgm30atwud&dl=0DISCORD SIGN UP LINK (PATREON): https://www.patreon.com/StrongManPersonalFinance/membershipSTRONG MAN WILL MAKE A DEDICATED VIDEO FOR YOU - https://www.dropbox.com/s/9wt3z47zgtpd1v9/Dedicated%20Video.docx?dl=0BOOK A 1-ON-1 WITH STRONG MAN- https://www.dropbox.com/s/1515qr7vfaskjmb/1%20ON%201%20WITH%20STRONG%20MAN.docx?dl=0FINANCIAL STATEMENT ACCOUNTING COURSES (PAID) - STRONG MAN WILL MAKE A DEDICATED VIDEO FOR YOU - https://www.dropbox.com/s/9wt3z47zgtpd1v9/Dedicated%20Video.docx?dl=0BUY MY BOOK ON AMAZON - STOP BEING A BROKE LOSER https://www.amazon.com/Stop-Being-Broke-Loser-Christopher/dp/B08P1GYFC3/ref=sr_1_1?dchild=1&keywords=stop+being+a+broke+loser&qid=1614566272&sr=8-1AMA Email Address: Christopher.a.bell18@gmail.com.Social Media:Facebook - https://www.facebook.com/StrongManPersonalFinanceTwitter - https://twitter.com/Christo46961600

The post Elon Musk’s Influence on Dogecoin (DOGE) Decoupling: A Deep Dive into Crypto Trends appeared on BitcoinEthereumNews.com . Dogecoin (DOGE) has outperformed other cryptocurrencies in the last 24 hours, with a price surge of over 7%. Despite the bearish trend in the crypto market, DOGE managed to decouple and maintain a bullish stance. Market indicators and metrics support this uptrend, possibly influenced by Tesla’s recent announcement regarding DOGE. Dogecoin bucks the bearish trend in the crypto market, surging by over 7% in the last 24 hours. This article explores the factors behind this bullish trend and what the future holds for DOGE. Dogecoin Remains Bullish While top coins like Bitcoin (BTC) and Ethereum (ETH) experienced marginal movement, Dogecoin defied the market trend with a significant price increase. Currently, DOGE is trading at $0.1616 with a market capitalization of over $23 billion, making it the eighth-largest cryptocurrency. The surge in DOGE’s trading volume has acted as a foundation for this bull rally, possibly influenced by Tesla’s recent announcement that DOGE can now be used to purchase more Tesla products.

… shareholder value, ethical leadership, and corporate accountability in the years to come.

One Wall Street analyst paints scenarios where Tesla stock could trade as high as $460 or as low as $70 per share, saying $230 is mostly likely.
Too little, too late. Continue reading on Predict »

The post Tesla Embraces DOGE (Dogecoin): A New Payment Option with a Twist appeared on BitcoinEthereumNews.com . In a recent development, Tesla, the leading electric car manufacturer, has officially added Dogecoin as a payment option. The move has sparked a significant price surge for the meme-inspired cryptocurrency, with a 21% spike in the past 24 hours. Despite the new addition, Tesla still only accepts Dogecoin for select merchandise on its online shop. Tesla, the prominent electric car producer, has officially embraced Dogecoin, causing a 21% spike in the cryptocurrency’s price. However, Dogecoin is currently only accepted for select merchandise on Tesla’s online shop. Tesla officially embraces Dogecoin Tesla, led by tech mogul Elon Musk, has officially added Dogecoin as a payment option on its website. The payments page now includes Dogecoin, a favorite amongst the crypto community. However, the company currently only accepts Dogecoin for select merchandise in the online Tesla Shop.
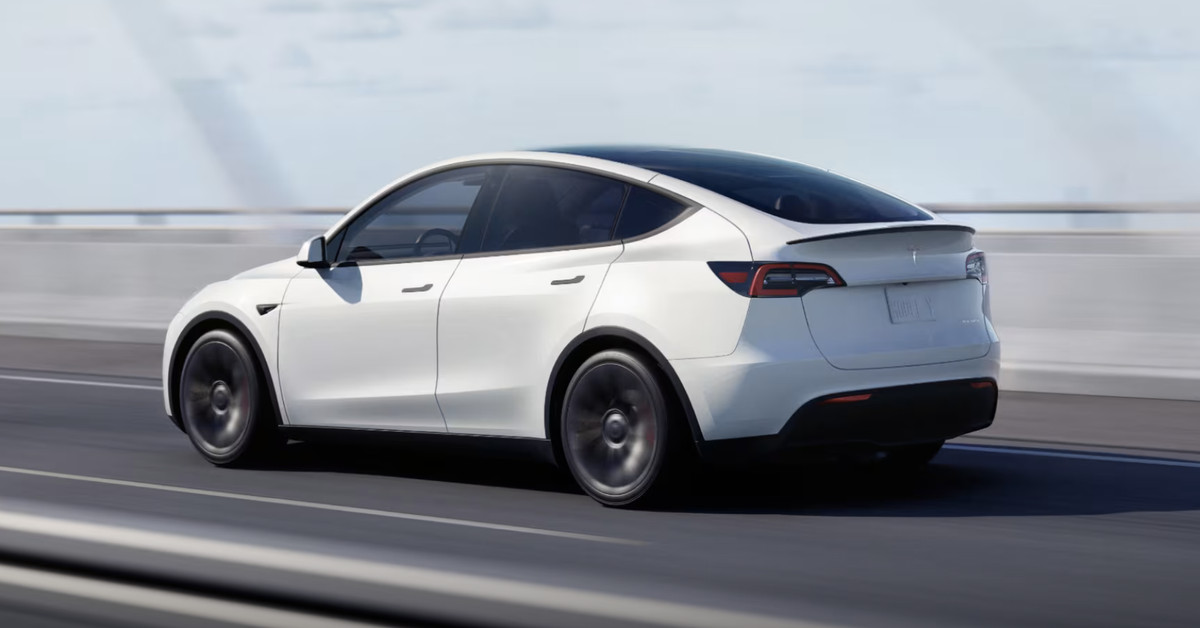
Image: Tesla Tesla CEO Elon Musk posted on Friday that the Standard Range rear-wheel drive Model Y the company has been building and selling “over the last several months” actually has more range than the 260 miles they were sold with. Pending “regulatory approval,” he wrote that the company will unlock another 40–60 miles of total range, depending on which battery Model Y owners have, “for $1,500 to $2,000.” Tesla replaced the Standard Range Model Y with a 320-mile range version for $2,000 more. The car now starts at $44,990 , or about $37,490 if you qualify for the $7,500 federal EV tax credit . The “260 mile” range Model Y’s built over the past several months actually have more range that can be unlocked for $1500 to $2000 (gains 40 to 60 miles… Continue reading…
Tesla Inc (TSLA) share price today is $181.02
Yes, Indians can buy shares of Tesla Inc (TSLA) on Vested. To buy Tesla Inc from India, you can open a US Brokerage account on Vested today by clicking on Sign Up or Invest in TSLA stock at the top of this page. The account opening process is completely digital and secure, and takes a few minutes to complete.
Yes, you can purchase fractional shares of Tesla Inc (TSLA) via the Vested app. You can start investing in Tesla Inc (TSLA) with a minimum investment of $1.
You can invest in shares of Tesla Inc (TSLA) via Vested in three simple steps:
The 52-week high price of Tesla Inc (TSLA) is $299.29. The 52-week low price of Tesla Inc (TSLA) is $138.8.
The price-to-earnings (P/E) ratio of Tesla Inc (TSLA) is 46.37
The price-to-book (P/B) ratio of Tesla Inc (TSLA) is 8.70
The dividend yield of Tesla Inc (TSLA) is 0.00%
The market capitalization of Tesla Inc (TSLA) is $568.16B
The stock symbol (or ticker) of Tesla Inc is TSLA
 Link copied


