

Invest in 5,000+ US Stocks and ETFs
* Offering through VF Securities, Inc. (member FINRA/SIPC)
 Skip to content
Union Pacific Corporation, through its subsidiary, Union Pacific Railroad Company, operates in the railroad business in the United States. The company offers transportation services for grain and grain products, fertilizers, food and refrigerated products, and coal and renewables to grain processors, animal feeders, ethanol producers, renewable biofuel producers, and other agricultural users; and construction products, industrial chemicals, plastics, forest products, specialized products, metals and ores, petroleum, liquid petroleum gases, soda ash, and sand, as well as finished automobiles, automotive parts, and merchandise in intermodal containers. Union Pacific Corporation was founded in 1862 and is headquartered in Omaha, Nebraska. more
| Time Frame | UNP | Sector | S&P500; |
|---|---|---|---|
| 1-Week Return | - | - | - |
| 1-Month Return | -4.38% | -1.82% | -3.5% |
| 3-Month Return | -2.5% | 7.66% | 3.86% |
| 6-Month Return | 11.53% | 22.05% | 17.98% |
| 1-Year Return | 17.6% | 21.48% | 22.44% |
| 3-Year Return | 11.04% | 25.73% | 25.9% |
| 5-Year Return | 45.7% | 68.46% | 86.97% |
| 10-Year Return | 201.9% | 175.29% | 221.66% |
| Dec '19 | Dec '20 | Dec '21 | Dec '22 | Dec '23 | 5YR TREND | |
|---|---|---|---|---|---|---|
| Total Revenue | 21.71B | 19.53B | 21.80B | 24.88B | 24.12B | [{"date":"2019-12-31","value":87.27,"profit":true},{"date":"2020-12-31","value":78.52,"profit":true},{"date":"2021-12-31","value":87.65,"profit":true},{"date":"2022-12-31","value":100,"profit":true},{"date":"2023-12-31","value":96.96,"profit":true}] |
| Cost of Revenue | 12.09B | 10.35B | 11.29B | 13.67B | 13.59B | [{"date":"2019-12-31","value":88.47,"profit":true},{"date":"2020-12-31","value":75.74,"profit":true},{"date":"2021-12-31","value":82.59,"profit":true},{"date":"2022-12-31","value":100,"profit":true},{"date":"2023-12-31","value":99.41,"profit":true}] |
| Gross Profit | 9.61B | 9.18B | 10.51B | 11.21B | 10.53B | [{"date":"2019-12-31","value":85.8,"profit":true},{"date":"2020-12-31","value":81.92,"profit":true},{"date":"2021-12-31","value":93.83,"profit":true},{"date":"2022-12-31","value":100,"profit":true},{"date":"2023-12-31","value":93.97,"profit":true}] |
| Gross Margin | 44.29% | 46.99% | 48.22% | 45.05% | 43.65% | [{"date":"2019-12-31","value":91.84,"profit":true},{"date":"2020-12-31","value":97.45,"profit":true},{"date":"2021-12-31","value":100,"profit":true},{"date":"2022-12-31","value":93.42,"profit":true},{"date":"2023-12-31","value":90.53,"profit":true}] |
| Operating Expenses | 1.06B | 1.34B | 1.18B | 1.29B | 1.45B | [{"date":"2019-12-31","value":73.26,"profit":true},{"date":"2020-12-31","value":92.95,"profit":true},{"date":"2021-12-31","value":81.27,"profit":true},{"date":"2022-12-31","value":89.01,"profit":true},{"date":"2023-12-31","value":100,"profit":true}] |
| Operating Income | 8.55B | 7.83B | 9.34B | 9.92B | 9.08B | [{"date":"2019-12-31","value":86.26,"profit":true},{"date":"2020-12-31","value":79,"profit":true},{"date":"2021-12-31","value":94.16,"profit":true},{"date":"2022-12-31","value":100,"profit":true},{"date":"2023-12-31","value":91.58,"profit":true}] |
| Total Non-Operating Income/Expense | (1.79B) | (2.00B) | (2.02B) | (2.12B) | (849.00M) | [{"date":"2019-12-31","value":-179400000000,"profit":false},{"date":"2020-12-31","value":-199500000000,"profit":false},{"date":"2021-12-31","value":-201700000000,"profit":false},{"date":"2022-12-31","value":-211600000000,"profit":false},{"date":"2023-12-31","value":-84900000000,"profit":false}] |
| Pre-Tax Income | 7.75B | 6.98B | 8.48B | 9.07B | 8.23B | [{"date":"2019-12-31","value":85.39,"profit":true},{"date":"2020-12-31","value":76.94,"profit":true},{"date":"2021-12-31","value":93.45,"profit":true},{"date":"2022-12-31","value":100,"profit":true},{"date":"2023-12-31","value":90.75,"profit":true}] |
| Income Taxes | 1.83B | 1.63B | 1.96B | 2.07B | 1.85B | [{"date":"2019-12-31","value":88.14,"profit":true},{"date":"2020-12-31","value":78.64,"profit":true},{"date":"2021-12-31","value":94.26,"profit":true},{"date":"2022-12-31","value":100,"profit":true},{"date":"2023-12-31","value":89.39,"profit":true}] |
| Income After Taxes | 5.92B | 5.35B | 6.52B | 7.00B | 6.38B | [{"date":"2019-12-31","value":84.58,"profit":true},{"date":"2020-12-31","value":76.44,"profit":true},{"date":"2021-12-31","value":93.21,"profit":true},{"date":"2022-12-31","value":100,"profit":true},{"date":"2023-12-31","value":91.15,"profit":true}] |
| Income From Continuous Operations | 5.92B | 5.35B | 6.52B | 7.00B | 6.38B | [{"date":"2019-12-31","value":84.58,"profit":true},{"date":"2020-12-31","value":76.44,"profit":true},{"date":"2021-12-31","value":93.21,"profit":true},{"date":"2022-12-31","value":100,"profit":true},{"date":"2023-12-31","value":91.15,"profit":true}] |
| Income From Discontinued Operations | - | - | - | - | - | [{"date":"2019-12-31","value":"-","profit":true},{"date":"2020-12-31","value":"-","profit":true},{"date":"2021-12-31","value":"-","profit":true},{"date":"2022-12-31","value":"-","profit":true},{"date":"2023-12-31","value":"-","profit":true}] |
| Net Income | 5.92B | 5.35B | 6.52B | 7.00B | 6.38B | [{"date":"2019-12-31","value":84.58,"profit":true},{"date":"2020-12-31","value":76.44,"profit":true},{"date":"2021-12-31","value":93.21,"profit":true},{"date":"2022-12-31","value":100,"profit":true},{"date":"2023-12-31","value":91.15,"profit":true}] |
| EPS (Diluted) | 8.39 | 8.19 | 9.95 | 11.36 | 10.46 | [{"date":"2019-12-31","value":73.86,"profit":true},{"date":"2020-12-31","value":72.1,"profit":true},{"date":"2021-12-31","value":87.59,"profit":true},{"date":"2022-12-31","value":100,"profit":true},{"date":"2023-12-31","value":92.08,"profit":true}] |
These ratios help you determine the liquidity of the company. Higher is better.
| UNP | |
|---|---|
| Cash Ratio | 0.21 |
| Current Ratio | 0.81 |
| Quick Ratio | 0.67 |
These ratios help you understand the company's efficiency in using its assets to generate returns. Higher is better. For ROE, average long term is around 14%, less than 10% is poor.
| UNP | |
|---|---|
| ROA (LTM) | 8.61% |
| ROE (LTM) | 47.34% |
These ratios help you understand the company's liabilities, gauging the riskiness of the investment.
| UNP | |
|---|---|
| Debt Ratio Lower is generally better. Negative is bad. | 0.78 |
| Common Equity/Total Assets Higher is better. Lower can suggest investment is riskier. | 0.22 |
| Debt/Equity The higher the number, the more leverage the business employs, the riskier the investment typically is. | 4.54 |
These ratios help you understand the company's valuation. Lower may indicate cheaper stocks.
| UNP | |
|---|---|
| Trailing PE | 21.99 |
| Forward PE | 20.88 |
| P/S (TTM) | 5.93 |
| P/B | 9.67 |
| Price/FCF | 102 |
| EV/R | 7.30 |
| EV/Ebitda | 14.81 |
| PEG | NM |

In January, I published MarketMasterAI’s top 500 stocks to buy for the first half of 2024 . The AI-powered system ranked the largest American firms by market capitalization and chose what it believed to be the best investments for the next six months. The first three months have been admittedly mixed. A-grade companies have performed splendidly, returning 12% since the year began. That’s well ahead of the 7.4% average, and roughly where we would expect to be at this point. However, a significant pullback in high-quality stocks means that the top A+ stocks have only returned 5.6% over the same period. Wins by firms like Eli Lilly (NYSE: LLY ) (up 33%) and Exxon Mobil (NYSE: XOM ) (up 22%) were not enough to offset the overall pivot away from high-quality non-tech firms. The cohort is only up half of what we would expect. Meanwhile, a resurgence of junk firms like Coinbase (NASDAQ: COIN ) was enough to power F-grade companies to an 11% gain. The results are far better once you consider companies beyond the top 500 picks.

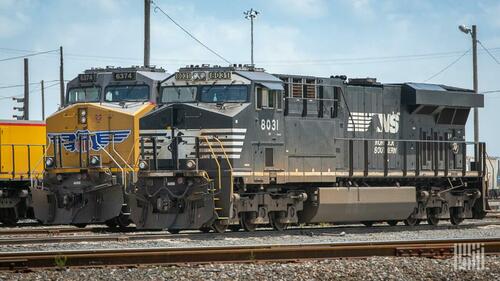
Transloading, a supply chain strategy used during Covid, is back, a tailwind for CH Robinson, Uber Freight, Union Pacific, JB Hunt and Schneider.

CNBC''s Lori Ann LaRocco joins Union Pacific President Beth Whited at this year''s TPM conference to discuss the state of the supply chain and trade with Mexico.
Amid Debate Over Rail Safety Concerns, Another Norfolk Southern Train Derails By John Kingston of FreightWaves With a Norfolk Southern derailment in Pennsylvania on Saturday that sent diesel fuel into a Lehigh Valley River, the already heated battle over control of the railroad with safety issues as a backdrop got even hotter. The derailment came after two days of charges, countercharges and missives flying back and forth over the safety records of both Norfolk Southern and Union Pacific, with leading government officials that regulate the rails leveling separate heavy criticism at the two companies. And while it hasn’t yet provoked any government response, the issue of safety and levels of employment could also be triggered by Friday’s news that BNSF had implemented a significant number of furloughs. In the proxy battle roiling Norfolk Southern, the activist investor group Ancora is recommending the replacement of eight new directors to the Norfolk Southern board. It also wants to replace CEO Alan Shaw with former UPS executive Jim Barber and name Jamie Boychuk, a former executive at CSX, to replace current COO Paul Duncan.
The Investment Committee share their Final Trades.
Union Pacific Corporation (UNP) share price today is $232.08
Yes, Indians can buy shares of Union Pacific Corporation (UNP) on Vested. To buy Union Pacific Corporation from India, you can open a US Brokerage account on Vested today by clicking on Sign Up or Invest in UNP stock at the top of this page. The account opening process is completely digital and secure, and takes a few minutes to complete.
Yes, you can purchase fractional shares of Union Pacific Corporation (UNP) via the Vested app. You can start investing in Union Pacific Corporation (UNP) with a minimum investment of $1.
You can invest in shares of Union Pacific Corporation (UNP) via Vested in three simple steps:
The 52-week high price of Union Pacific Corporation (UNP) is $257.33. The 52-week low price of Union Pacific Corporation (UNP) is $185.99.
The price-to-earnings (P/E) ratio of Union Pacific Corporation (UNP) is 22.21
The price-to-book (P/B) ratio of Union Pacific Corporation (UNP) is 9.67
The dividend yield of Union Pacific Corporation (UNP) is 2.27%
The market capitalization of Union Pacific Corporation (UNP) is $141.59B
The stock symbol (or ticker) of Union Pacific Corporation is UNP
 Link copied


