

Invest in 5,000+ US Stocks and ETFs
* Offering through VF Securities, Inc. (member FINRA/SIPC)
 Skip to content
Wells Fargo & Company, a financial services company, provides diversified banking, investment, mortgage, and consumer and commercial finance products and services in the United States and internationally. The company operates through four segments: Consumer Banking and Lending; Commercial Banking; Corporate and Investment Banking; and Wealth and Investment Management. The Consumer Banking and Lending segment offers diversified financial products and services for consumers and small businesses. Its financial products and services include checking and savings accounts, and credit and debit cards, as well as home, auto, personal, and small business lending services. The Commercial Banking segment provides financial solutions to private, family owned, and certain public companies. Its products and services include banking and credit products across various industry sectors and municipalities, secured lending and lease products, and treasury management services. The Corporate and Investment Banking segment offers a suite of capital markets, banking, and financial products and services, such as corporate banking, investment banking, treasury management, commercial real estate lending and servicing, equity, and fixed income solutions, as well as sales, trading, and research capabilities services to corporate, commercial real estate, government, and institutional clients. The Wealth and Investment Management segment provides personalized wealth management, brokerage, financial planning, lending, private banking, and trust and fiduciary products and services to affluent, high-net worth, and ultra-high-net worth clients. It also operates through financial advisors in brokerage and wealth offices, consumer bank branches, independent offices, and digitally through WellsTrade and Intuitive Investor. The company was founded in 1852 and is headquartered in San Francisco, California. more
| Time Frame | WFC | Sector | S&P500 |
|---|---|---|---|
| 1-Week Return | - | -0.88% | -0.64% |
| 1-Month Return | 4.87% | -2.86% | -2.75% |
| 3-Month Return | 23.02% | 4.8% | 2.89% |
| 6-Month Return | 44.96% | 20.82% | 17.07% |
| 1-Year Return | 59.96% | 28.85% | 25.71% |
| 3-Year Return | 41.48% | 17.46% | 26.45% |
| 5-Year Return | 42.26% | 59.56% | 86.7% |
| 10-Year Return | 61.41% | 243.55% | 222.9% |
| Dec '19 | Dec '20 | Dec '21 | Dec '22 | Dec '23 | 5YR TREND | |
|---|---|---|---|---|---|---|
| Total Revenue | 85.06B | 72.34B | 78.49B | 73.78B | 82.60B | [{"date":"2019-12-31","value":100,"profit":true},{"date":"2020-12-31","value":85.04,"profit":true},{"date":"2021-12-31","value":92.28,"profit":true},{"date":"2022-12-31","value":86.74,"profit":true},{"date":"2023-12-31","value":97.1,"profit":true}] |
| Cost of Revenue | - | - | - | - | - | [{"date":"2019-12-31","value":"-","profit":true},{"date":"2020-12-31","value":"-","profit":true},{"date":"2021-12-31","value":"-","profit":true},{"date":"2022-12-31","value":"-","profit":true},{"date":"2023-12-31","value":"-","profit":true}] |
| Gross Profit | 85.06B | 72.34B | 78.49B | 73.78B | 82.60B | [{"date":"2019-12-31","value":100,"profit":true},{"date":"2020-12-31","value":85.04,"profit":true},{"date":"2021-12-31","value":92.28,"profit":true},{"date":"2022-12-31","value":86.74,"profit":true},{"date":"2023-12-31","value":97.1,"profit":true}] |
| Gross Margin | 100.00% | 100.00% | 100.00% | 100.00% | 100.00% | [{"date":"2019-12-31","value":100,"profit":true},{"date":"2020-12-31","value":100,"profit":true},{"date":"2021-12-31","value":100,"profit":true},{"date":"2022-12-31","value":100,"profit":true},{"date":"2023-12-31","value":100,"profit":true}] |
| Operating Expenses | 58.26B | 57.67B | 53.79B | 57.28B | 55.56B | [{"date":"2019-12-31","value":100,"profit":true},{"date":"2020-12-31","value":98.98,"profit":true},{"date":"2021-12-31","value":92.33,"profit":true},{"date":"2022-12-31","value":98.31,"profit":true},{"date":"2023-12-31","value":95.37,"profit":true}] |
| Operating Income | 25.97B | 4.04B | 28.85B | 14.97B | 21.64B | [{"date":"2019-12-31","value":90,"profit":true},{"date":"2020-12-31","value":14.01,"profit":true},{"date":"2021-12-31","value":100,"profit":true},{"date":"2022-12-31","value":51.89,"profit":true},{"date":"2023-12-31","value":74.99,"profit":true}] |
| Total Non-Operating Income/Expense | 71.43B | 38.30B | 35.74B | 44.95B | 74.67B | [{"date":"2019-12-31","value":95.66,"profit":true},{"date":"2020-12-31","value":51.29,"profit":true},{"date":"2021-12-31","value":47.87,"profit":true},{"date":"2022-12-31","value":60.19,"profit":true},{"date":"2023-12-31","value":100,"profit":true}] |
| Pre-Tax Income | 25.97B | 2.50B | 28.82B | 14.97B | 21.64B | [{"date":"2019-12-31","value":90.11,"profit":true},{"date":"2020-12-31","value":8.69,"profit":true},{"date":"2021-12-31","value":100,"profit":true},{"date":"2022-12-31","value":51.95,"profit":true},{"date":"2023-12-31","value":75.08,"profit":true}] |
| Income Taxes | 5.76B | 1.16B | 5.58B | 2.09B | 2.61B | [{"date":"2019-12-31","value":100,"profit":true},{"date":"2020-12-31","value":20.08,"profit":true},{"date":"2021-12-31","value":96.82,"profit":true},{"date":"2022-12-31","value":36.23,"profit":true},{"date":"2023-12-31","value":45.25,"profit":true}] |
| Income After Taxes | 20.21B | 1.35B | 23.24B | 12.88B | 19.03B | [{"date":"2019-12-31","value":86.95,"profit":true},{"date":"2020-12-31","value":5.8,"profit":true},{"date":"2021-12-31","value":100,"profit":true},{"date":"2022-12-31","value":55.44,"profit":true},{"date":"2023-12-31","value":81.89,"profit":true}] |
| Income From Continuous Operations | 20.04B | 3.59B | 23.24B | 12.88B | 17.94B | [{"date":"2019-12-31","value":86.24,"profit":true},{"date":"2020-12-31","value":15.43,"profit":true},{"date":"2021-12-31","value":100,"profit":true},{"date":"2022-12-31","value":55.44,"profit":true},{"date":"2023-12-31","value":77.21,"profit":true}] |
| Income From Discontinued Operations | - | - | - | - | - | [{"date":"2019-12-31","value":"-","profit":true},{"date":"2020-12-31","value":"-","profit":true},{"date":"2021-12-31","value":"-","profit":true},{"date":"2022-12-31","value":"-","profit":true},{"date":"2023-12-31","value":"-","profit":true}] |
| Net Income | 19.71B | 1.79B | 22.11B | 13.68B | 19.14B | [{"date":"2019-12-31","value":89.17,"profit":true},{"date":"2020-12-31","value":8.08,"profit":true},{"date":"2021-12-31","value":100,"profit":true},{"date":"2022-12-31","value":61.86,"profit":true},{"date":"2023-12-31","value":86.58,"profit":true}] |
| EPS (Diluted) | 4.33 | 0.41 | 4.90 | 3.61 | 5.16 | [{"date":"2019-12-31","value":83.91,"profit":true},{"date":"2020-12-31","value":7.95,"profit":true},{"date":"2021-12-31","value":94.96,"profit":true},{"date":"2022-12-31","value":69.96,"profit":true},{"date":"2023-12-31","value":100,"profit":true}] |
These ratios help you determine the liquidity of the company. Higher is better.
| WFC | |
|---|---|
| Cash Ratio | 0.21 |
| Current Ratio | 0.96 |
These ratios help you understand the company's efficiency in using its assets to generate returns. Higher is better. For ROE, average long term is around 14%, less than 10% is poor.
| WFC | |
|---|---|
| ROA (LTM) | 0.98% |
| ROE (LTM) | 10.26% |
These ratios help you understand the company's liabilities, gauging the riskiness of the investment.
| WFC | |
|---|---|
| Debt Ratio Lower is generally better. Negative is bad. | 0.91 |
| Common Equity/Total Assets Higher is better. Lower can suggest investment is riskier. | 0.09 |
| Debt/Equity The higher the number, the more leverage the business employs, the riskier the investment typically is. | 10.40 |
These ratios help you understand the company's valuation. Lower may indicate cheaper stocks.
| WFC | |
|---|---|
| Trailing PE | 12.46 |
| Forward PE | 11.83 |
| P/S (TTM) | 2.55 |
| P/B | 1.22 |
| EV/R | 0.00 |
| EV/Ebitda | NM |
| PEG | 0.22 |

Wall Street is abuzz over the Viking Holdings (NYSE: VIK ) stock initial public offering (IPO) as the cruise operator begins trading today. With the offering, Viking raised $1.54 billion on about 64 million shares , implying a valuation of about $10.3 billion. This makes it one of the largest U.S. stock market debuts so far this year. Viking priced its IPO close to the top end of its range at $24 per share. The company is set to begin trading later today, as investors eagerly await the chance to grab up one of the most promising offerings in recent memory. Viking is perhaps best-known for art and history-rich river tours throughout much of Europe, although its fleet now expands across the globe. Despite the expansion, Viking still primarily appeals to older, wealthier travelers seeking a more luxury experience. “We maintain a clear focus on our most relevant customer group: English-speaking travelers aged 55 years old and over, who have the time, money and desire to explore the world,” wrote Viking founder and CEO Torstein Hagen . “We do not try to be all things to all people, which is why we only offer a single-language experience on board our ships; there are no casinos; and children under 18 are not allowed.” So, what do you need to know about Viking ahead of its stock market debut? 7 Things to Know About the VIK Stock IPO Viking will trade on the New York Stock Exchange later on Wednesday, May 1, under the “VIK” ticker symbol.

The Texas Attorney General’s staff met with municipal finance executives from Wells Fargo & Co. and RBC Capital Markets as Ken Paxton’s probe into whether the Wall Street banks “boycott” the fossil fuels industry drags on.
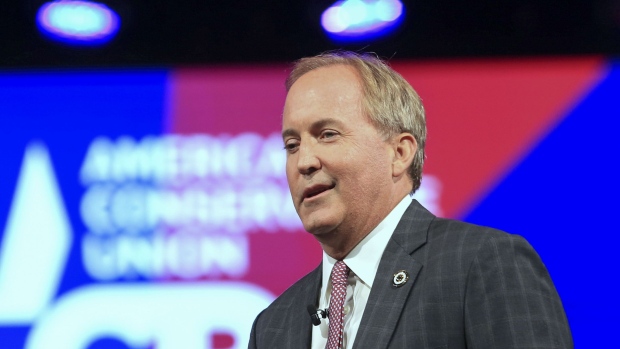
The Texas Attorney General’s staff met with municipal finance executives from Wells Fargo & Co. and RBC Capital Markets as Ken Paxton’s probe into whether the Wall Street banks “boycott” the fossil fuels industry drags on.

Wells Fargo rolls out a business card with no annual fee and tons of value.
Wells Fargo & Company shared on Tuesday that the bank''s board of directors authorized a quarterly common stock dividend of $0.35 per share.The dividend will be paid on June 1, 2024, to shareholder…
Wells Fargo & Company (NYSE: WFC) announced today that its shareholders elected as directors the 13 nominees named in the company’s proxy statement, including a new independent director: Fabian T. Garcia. Upon his election, Garcia was appointed to the Board’s Finance Committee. This press release features multimedia. View the full release here: https://www.businesswire.com/news/home/20240430442738/en/ Jetzt den vollständigen Artikel lesen

Down roughly 10% to start the year, Apple (NASDAQ: AAPL ) stock investors remain on edge. The smartphone maker faces key challenges before their upcoming earnings report on May 2. Despite weakness in iPhone sales in China and regulatory scrutiny, price target of $225 from Wells Fargo (NYSE: WFC ) shows room for positivity. The company plans to showcase more of its generative AI features in its iOS. However, investors are worried about the costs associated with this AI rollout. Apple investors also expect a significant May 7 event that could boost stock performance. Although the company has not disclosed any more specific information on the event, the public expects it could be a launch of new iPads. Apple has seen no updates on the said gadgets since 2022, and many are expecting news on this front. Let’s dive more into what to expect with this upcoming report, and what investors will be watching. Earnings Report and AAPL Stock Seeing lower revenues in recent quarters, Wall Street’s expectations for Apple are not too high this time around.

Two more Wells Fargo customers have revealed they lost tens of thousands of dollars to scammers as the bank faces a spate of lawsuits questioning the robustness of its anti-fraud measures.

In this article, we will take a look at the 5 best cheap stocks to buy for 2024. If you’d like to go through our overview of investing and some recent financial news, then please take a look at the 15 Best Cheap Stocks To Buy For 2024. 5. Wells Fargo & Company (NYSE:WFC) Number […]
Wells Fargo & Company (WFC) share price today is $59.94
Yes, Indians can buy shares of Wells Fargo & Company (WFC) on Vested. To buy Wells Fargo & Company from India, you can open a US Brokerage account on Vested today by clicking on Sign Up or Invest in WFC stock at the top of this page. The account opening process is completely digital and secure, and takes a few minutes to complete.
Yes, you can purchase fractional shares of Wells Fargo & Company (WFC) via the Vested app. You can start investing in Wells Fargo & Company (WFC) with a minimum investment of $1.
You can invest in shares of Wells Fargo & Company (WFC) via Vested in three simple steps:
The 52-week high price of Wells Fargo & Company (WFC) is $61.76. The 52-week low price of Wells Fargo & Company (WFC) is $36.31.
The price-to-earnings (P/E) ratio of Wells Fargo & Company (WFC) is 12.41
The price-to-book (P/B) ratio of Wells Fargo & Company (WFC) is 1.22
The dividend yield of Wells Fargo & Company (WFC) is 2.34%
The market capitalization of Wells Fargo & Company (WFC) is $219.23B
The stock symbol (or ticker) of Wells Fargo & Company is WFC
 Link copied


