

Invest in 5,000+ US Stocks and ETFs
* Offering through VF Securities, Inc. (member FINRA/SIPC)
 Skip to content
Zillow Group, Inc. operates real estate brands in mobile applications and Websites in the United States. The company offers premier agent and rentals marketplaces, new construction marketplaces, advertising, display advertising, and business technology solutions, as well as dotloop and floor plans. It also provides mortgage originations and the sale of mortgages, and advertising to mortgage lenders and other mortgage professionals; and title and escrow services. In addition, the company's brand portfolio includes Zillow Premier Agent, Zillow Home Loans, Zillow Rentals, Trulia, StreetEasy, HotPads, and Out East; and a suite of marketing software and technology solutions for the real estate industry, including ShowingTime+, Spruce, and Follow Up Boss. Zillow Group, Inc. was incorporated in 2004 and is headquartered in Seattle, Washington. more
| Time Frame | Z | Sector | S&P500; |
|---|---|---|---|
| 1-Week Return | -9.71% | -3.13% | -2.86% |
| 1-Month Return | -9.1% | -0.83% | -1.97% |
| 3-Month Return | -17.4% | 9.34% | 6.55% |
| 6-Month Return | 1.88% | 18.04% | 16.59% |
| 1-Year Return | -4.92% | 37.16% | 23.76% |
| 3-Year Return | -67.81% | 7.01% | 26.55% |
| 5-Year Return | 13.52% | 70.61% | 88.95% |
| 10-Year Return | 56.2% | 68.73% | 226.52% |
| Dec '19 | Dec '20 | Dec '21 | Dec '22 | Dec '23 | 5YR TREND | |
|---|---|---|---|---|---|---|
| Total Revenue | 2.74B | 3.34B | 8.15B | 1.96B | 1.95B | [{"date":"2019-12-31","value":33.67,"profit":true},{"date":"2020-12-31","value":40.99,"profit":true},{"date":"2021-12-31","value":100,"profit":true},{"date":"2022-12-31","value":24.03,"profit":true},{"date":"2023-12-31","value":23.87,"profit":true}] |
| Cost of Revenue | 1.43B | 1.76B | 6.39B | 367.00M | 421.00M | [{"date":"2019-12-31","value":22.4,"profit":true},{"date":"2020-12-31","value":27.47,"profit":true},{"date":"2021-12-31","value":100,"profit":true},{"date":"2022-12-31","value":5.74,"profit":true},{"date":"2023-12-31","value":6.58,"profit":true}] |
| Gross Profit | 1.31B | 1.58B | 1.75B | 1.59B | 1.52B | [{"date":"2019-12-31","value":74.77,"profit":true},{"date":"2020-12-31","value":90.32,"profit":true},{"date":"2021-12-31","value":100,"profit":true},{"date":"2022-12-31","value":90.75,"profit":true},{"date":"2023-12-31","value":86.93,"profit":true}] |
| Gross Margin | 47.79% | 47.41% | 21.52% | 81.26% | 78.35% | [{"date":"2019-12-31","value":58.81,"profit":true},{"date":"2020-12-31","value":58.35,"profit":true},{"date":"2021-12-31","value":26.48,"profit":true},{"date":"2022-12-31","value":100,"profit":true},{"date":"2023-12-31","value":96.43,"profit":true}] |
| Operating Expenses | 1.56B | 1.55B | 2.00B | 1.66B | 1.77B | [{"date":"2019-12-31","value":77.91,"profit":true},{"date":"2020-12-31","value":77.42,"profit":true},{"date":"2021-12-31","value":100,"profit":true},{"date":"2022-12-31","value":83.02,"profit":true},{"date":"2023-12-31","value":88.58,"profit":true}] |
| Operating Income | (246.84M) | 60.94M | (246.21M) | (26.00M) | (270.00M) | [{"date":"2019-12-31","value":-405.04,"profit":false},{"date":"2020-12-31","value":100,"profit":true},{"date":"2021-12-31","value":-404.01,"profit":false},{"date":"2022-12-31","value":-42.66,"profit":false},{"date":"2023-12-31","value":-443.05,"profit":false}] |
| Total Non-Operating Income/Expense | (164.58M) | (385.81M) | (472.22M) | (94.00M) | 93.00M | [{"date":"2019-12-31","value":-176.96,"profit":false},{"date":"2020-12-31","value":-414.85,"profit":false},{"date":"2021-12-31","value":-507.76,"profit":false},{"date":"2022-12-31","value":-101.08,"profit":false},{"date":"2023-12-31","value":100,"profit":true}] |
| Pre-Tax Income | (309.62M) | (169.64M) | (526.51M) | (85.00M) | (154.00M) | [{"date":"2019-12-31","value":-30961900000,"profit":false},{"date":"2020-12-31","value":-16963800000,"profit":false},{"date":"2021-12-31","value":-52651400000,"profit":false},{"date":"2022-12-31","value":-8500000000,"profit":false},{"date":"2023-12-31","value":-15400000000,"profit":false}] |
| Income Taxes | (4.26M) | (7.52M) | 1.26M | 3.00M | 4.00M | [{"date":"2019-12-31","value":-106.45,"profit":false},{"date":"2020-12-31","value":-188.07,"profit":false},{"date":"2021-12-31","value":31.57,"profit":true},{"date":"2022-12-31","value":75,"profit":true},{"date":"2023-12-31","value":100,"profit":true}] |
| Income After Taxes | (305.36M) | (162.12M) | (527.78M) | (88.00M) | (158.00M) | [{"date":"2019-12-31","value":-30536100000,"profit":false},{"date":"2020-12-31","value":-16211500000,"profit":false},{"date":"2021-12-31","value":-52777700000,"profit":false},{"date":"2022-12-31","value":-8800000000,"profit":false},{"date":"2023-12-31","value":-15800000000,"profit":false}] |
| Income From Continuous Operations | (305.36M) | (162.12M) | (527.78M) | (88.00M) | (157.00M) | [{"date":"2019-12-31","value":-30536100000,"profit":false},{"date":"2020-12-31","value":-16211500000,"profit":false},{"date":"2021-12-31","value":-52777700000,"profit":false},{"date":"2022-12-31","value":-8800000000,"profit":false},{"date":"2023-12-31","value":-15700000000,"profit":false}] |
| Income From Discontinued Operations | (167.00M) | (167.00M) | (630.00M) | (13.00M) | - | [{"date":"2019-12-31","value":-16700000000,"profit":false},{"date":"2020-12-31","value":-16700000000,"profit":false},{"date":"2021-12-31","value":-63000000000,"profit":false},{"date":"2022-12-31","value":-1300000000,"profit":false},{"date":"2023-12-31","value":"-","profit":true}] |
| Net Income | (305.36M) | (162.12M) | (527.78M) | (88.00M) | (158.00M) | [{"date":"2019-12-31","value":-30536100000,"profit":false},{"date":"2020-12-31","value":-16211500000,"profit":false},{"date":"2021-12-31","value":-52777700000,"profit":false},{"date":"2022-12-31","value":-8800000000,"profit":false},{"date":"2023-12-31","value":-15800000000,"profit":false}] |
| EPS (Diluted) | (0.54) | 0.36 | (0.49) | 1.55 | 1.27 | [{"date":"2019-12-31","value":-34.84,"profit":false},{"date":"2020-12-31","value":23.23,"profit":true},{"date":"2021-12-31","value":-31.61,"profit":false},{"date":"2022-12-31","value":100,"profit":true},{"date":"2023-12-31","value":81.94,"profit":true}] |
These ratios help you determine the liquidity of the company. Higher is better.
| Z | |
|---|---|
| Cash Ratio | 2.89 |
| Current Ratio | 3.24 |
| Quick Ratio | 3.14 |
These ratios help you understand the company's efficiency in using its assets to generate returns. Higher is better. For ROE, average long term is around 14%, less than 10% is poor.
| Z | |
|---|---|
| ROA (LTM) | -2.34% |
| ROE (LTM) | -3.51% |
These ratios help you understand the company's liabilities, gauging the riskiness of the investment.
| Z | |
|---|---|
| Debt Ratio Lower is generally better. Negative is bad. | 0.32 |
| Common Equity/Total Assets Higher is better. Lower can suggest investment is riskier. | 0.68 |
| Debt/Equity The higher the number, the more leverage the business employs, the riskier the investment typically is. | 1.47 |
These ratios help you understand the company's valuation. Lower may indicate cheaper stocks.
| Z | |
|---|---|
| Trailing PE | NM |
| Forward PE | 31.95 |
| P/S (TTM) | 5.31 |
| P/B | 2.29 |
| Price/FCF | 218 |
| EV/R | 4.80 |
| EV/Ebitda | 89.86 |
| PEG | 0.99 |
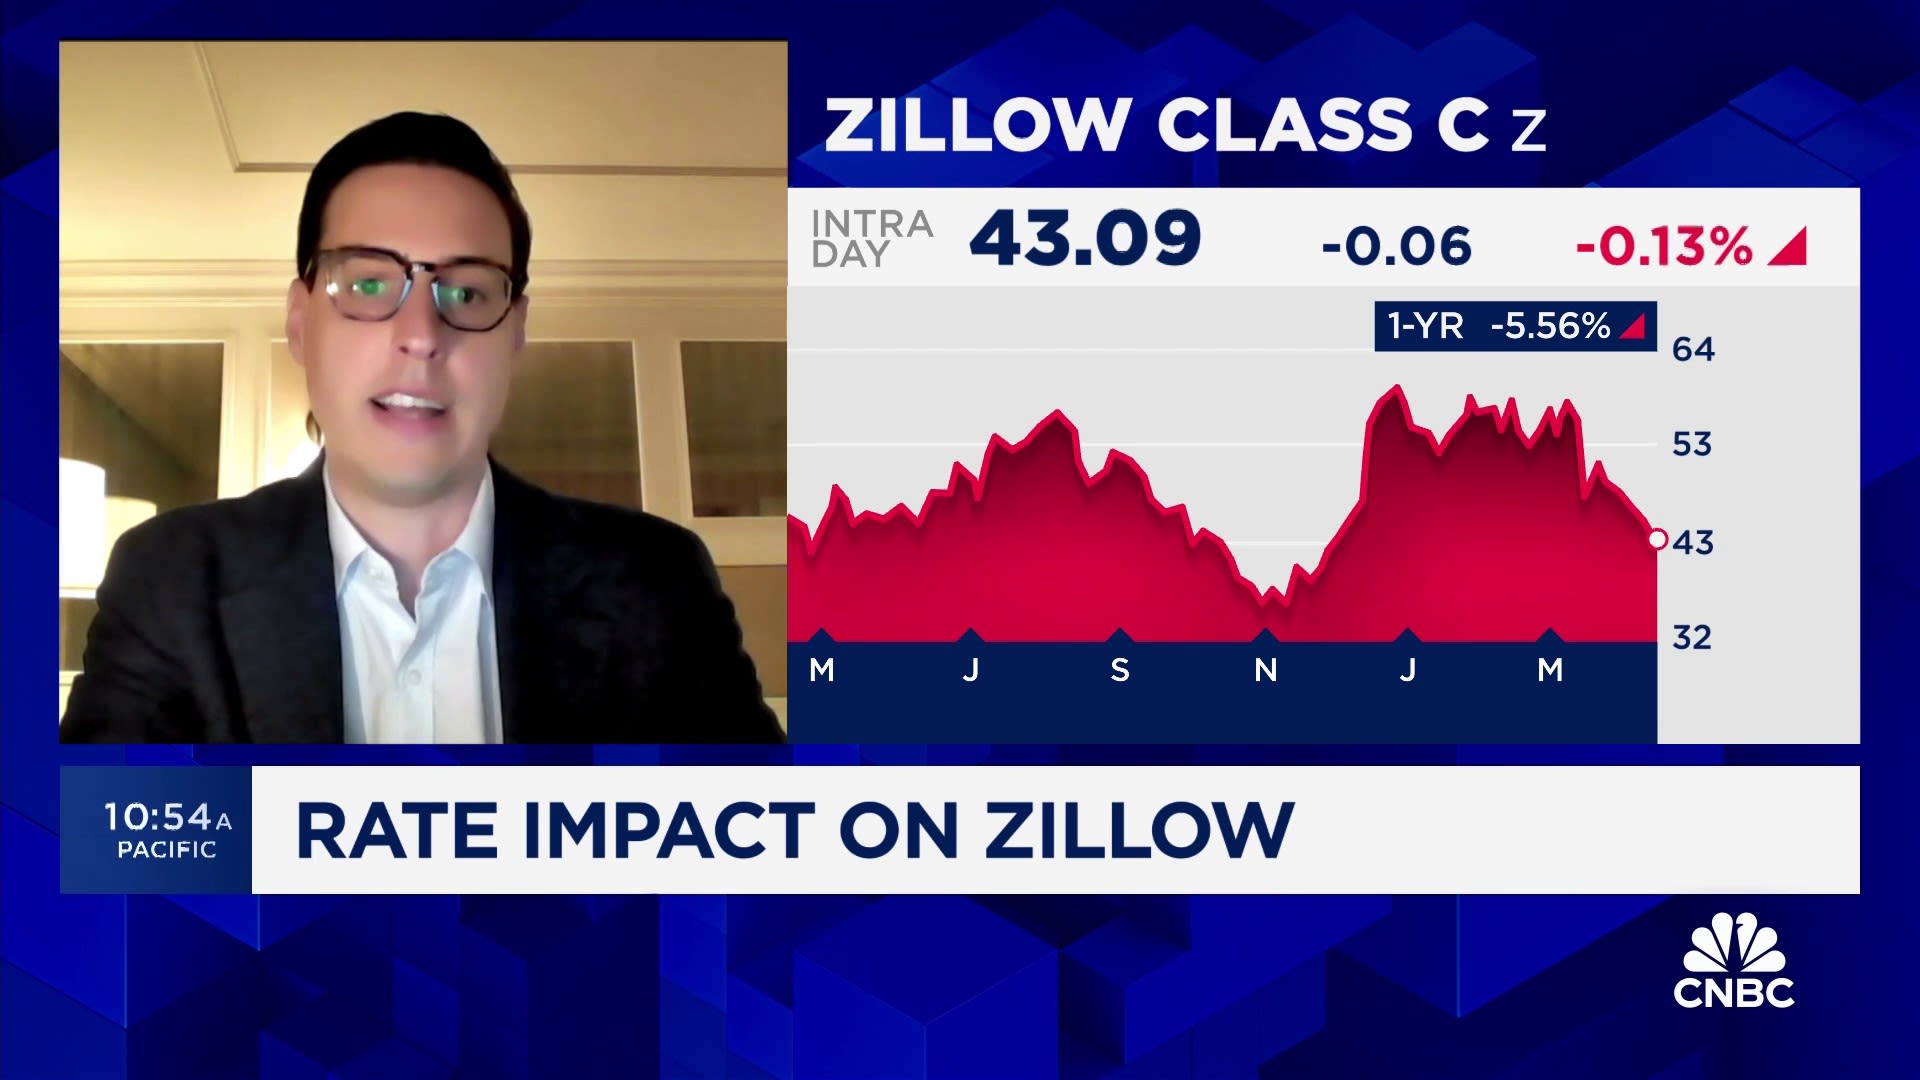
John Colantuoni, senior internet analyst at Jeffries, joins CNBC''s ''The Exchange'' to share why Zillow is his top pick.

Zillow''s new Showcase listings, powered by AI, are revolutionizing the real estate market by selling homes faster and for higher prices. According to Zillow data, Showcase listings are 20% more likely to secure an accepted offer within 14 days and sell for 2% more, translating to over $9,000 on average. These listings attract more views, saves, and shares, standing out with high-quality 3D tours and interactive floor plans.

The Exodus Continues: Blue Regions Still Bleeding As Residents Escape Democrat Policies Can Democrats take a hint? The answer is obviously no, but with millions of people flooding out of Democrat controlled places and relocating to more conservative regions one might think they would finally get the message. Blue cities and states across the US have been experiencing a mass exodus of legal residents since before the pandemic event; many of them business owners taking their money (and job opportunities) with them. The hardest hit states in the country include New York, Illinois and California, with cities like NYC, LA, Chicago and San Francisco seeing some of the most aggressive population shift. In states like California the standard operating procedure has been to lie about the situation, using the surge of illegal immigrants to hide population loss in the census. There are a multitude of reasons for the great American migration: The pandemic lockdowns made many people realize Democrats are inclined towards authoritarian policies and they left because they wanted freedom.

Adial Pharmaceuticals (NASDAQ: ADIL ) stock is heading higher on Wednesday following positive results from a peer review of its Alcohol Use Disorder ( AUD ) treatment. This peer review focuses on Phase 3 clinical trial results for AD04. The article highlights the positive performance of the treatment as well as the safety data. The publication behind this article is the European Journal of Internal Medicine . Adial Pharmaceuticals CEO Cary Claiborne said the following about the peer-reviewed results. “Most importantly, the publication highlighted the potential of AD04 for the treatment for AUD among patients with a specified genetic background. Ultimately, we believe AD04 could pave the way for precision treatments tailored to individuals with AUD, offering a novel strategy to not only manage alcohol consumption but also mitigate liver damage in affected populations.” How This Affects ADIL Stock Today Investors are celebrating the peer-reviewed article with heavy trading of ADIL stock on Wednesday.

$Z is set to transform Zeta Markets, Solana’s leading perpetuals exchange, driving its governance and growth. Zeta Markets boasts over $4B in trading volume and serves 71.6k monthly active users. It leads the shift from centralized to DeFi trading. Zeta Leads the CeFi to DeFi Evolution The Zeta Vision is to dominate the multi-trillion dollar […] The post $Z Launch: Zeta Markets’ DeFi Revolution on Solana appeared first on Altcoin Buzz .

Bad news for Zillow''s key customers created concern around the company''s future performance.
Conference call to be webcast live at 2 p.m. PT / 5 p.m. ET SEATTLE, April 8, 2024 /PRNewswire/ -- Zillow Group, Inc. (Nasdaq: Z and ZG) announced today it will release first-quarter 2024 financial results after market close on Wednesday, May 1, 2024. The company will host a conference…

Spencer Rascoff, Zillow co-founder, joins ''Closing Bell Overtime'' to discuss the state of the housing market as home prices remain elevated in a tight market.
Zillow Group Inc Class C (Z) share price today is $43.33
Yes, Indians can buy shares of Zillow Group Inc Class C (Z) on Vested. To buy Zillow Group Inc Class C from India, you can open a US Brokerage account on Vested today by clicking on Sign Up or Invest in Z stock at the top of this page. The account opening process is completely digital and secure, and takes a few minutes to complete.
Yes, you can purchase fractional shares of Zillow Group Inc Class C (Z) via the Vested app. You can start investing in Zillow Group Inc Class C (Z) with a minimum investment of $1.
You can invest in shares of Zillow Group Inc Class C (Z) via Vested in three simple steps:
The 52-week high price of Zillow Group Inc Class C (Z) is $61.13. The 52-week low price of Zillow Group Inc Class C (Z) is $33.8.
The price-to-earnings (P/E) ratio of Zillow Group Inc Class C (Z) is NM
The price-to-book (P/B) ratio of Zillow Group Inc Class C (Z) is 2.29
The dividend yield of Zillow Group Inc Class C (Z) is 0.00%
The market capitalization of Zillow Group Inc Class C (Z) is $9.81B
The stock symbol (or ticker) of Zillow Group Inc Class C is Z
 Link copied


